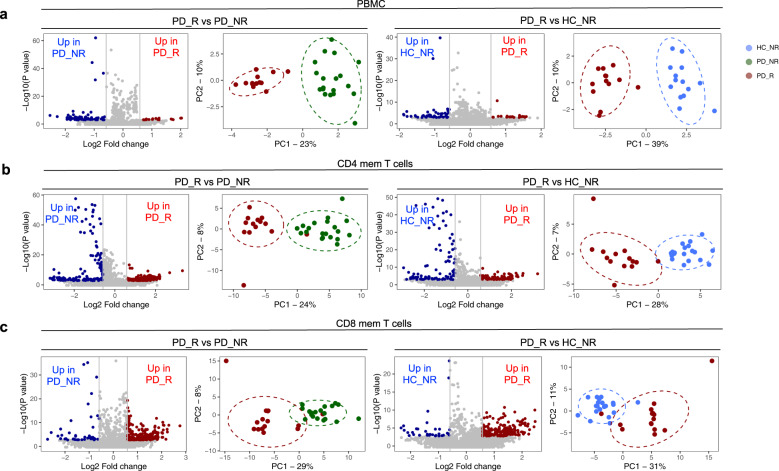
Fig. 2. α-syn specific T cell reactivity is associated with a unique gene expression profile.
Volcano plots show log2 fold change vs. −log10(P value) for the PD_R (n = 15) vs. PD_NR (n = 21) and PD_R vs. HC_NR (n = 20), respectively. The subset of genes with an absolute log2 fold change >1.5 and adjusted p-value less than 0.05 were considered significant and are indicated by dotted lines. Red dots of volcano plots indicate protein-coding genes upregulated in PD_R and blue dots indicate protein-coding genes downregulated in PD_NR or HC_NR. PCA plots show distinct clusters of PD_R, PD_NR and HC_NR (a) PBMC (b) CD4 memory T cells (c) CD8 memory T cells based on differentially expressed protein-coding genes.

