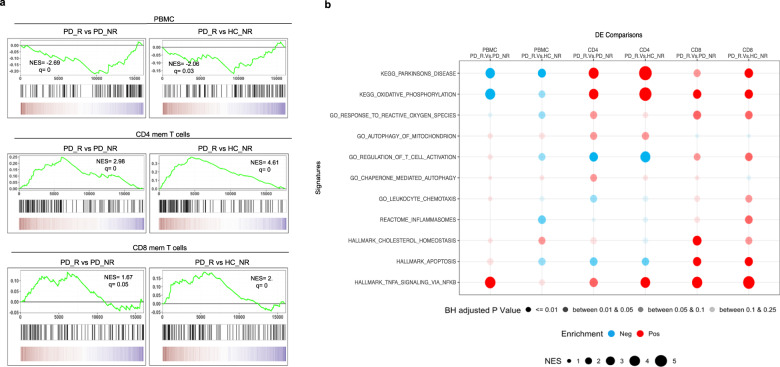
Fig. 3. GSEA of the protein-coding transcriptome of PD_R vs. PD_NR and PD_R vs. HC_NR reveals enrichment of PD-associated gene signature in CD4 and CD8 memory T cells.
a GSEA for the KEGG PD gene set. The y-axis of the plot shows the enrichment score (ES) for the gene set as the analysis moves down the ranked list of genes. The direction of the peak shows the degree to which the gene set is represented at the top or bottom of the ranked list of genes. The black bars on the x-axis show where the genes in the ranked list appear. The red portion at the bottom shows genes upregulated in PD_R and the blue portions represent the genes downregulated in PD_R (upregulated in HC_NR or PD_NR). q false discovery rate, NES normalized enrichment score. b Bubble plot demonstrating the enrichment status of several pathways previously reported to be implicated in PD. The red bubble indicates positive enrichment and the blue bubble indicates negative enrichment. The size of the bubble is directly proportional to the normalized enrichment score and the color shade of the bubble is proportional to the adjusted p value, where a darker bubble indicates higher significance than the lighter shade.

