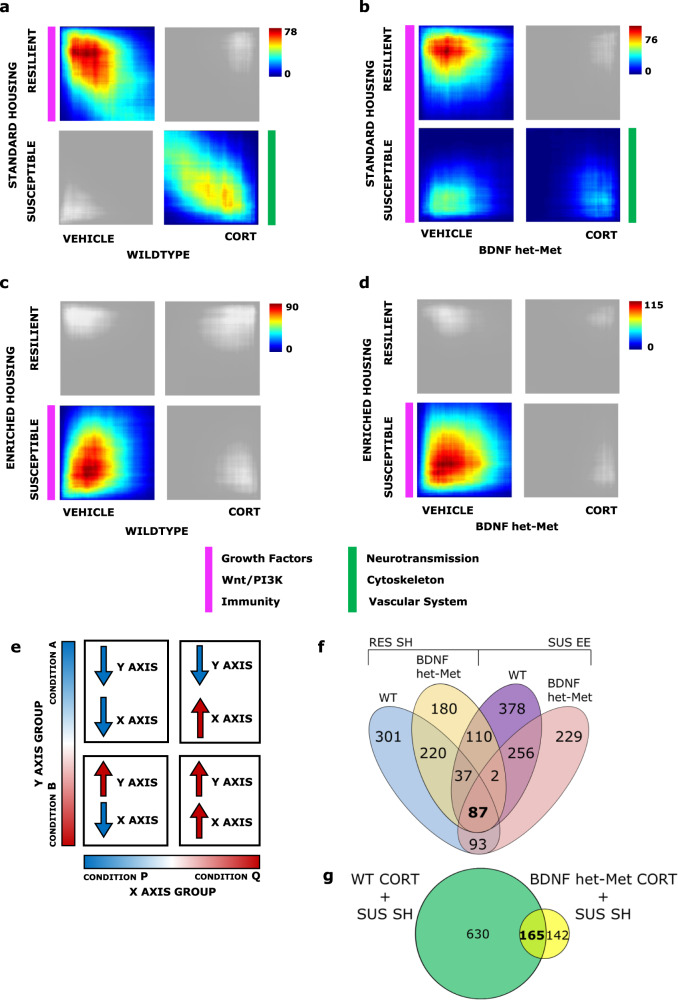
Fig. 2. Genomic signatures parallels vulnerability to stress across models and is modulated by housing condition or genotype.
a–d Each RRHO contained 17,122 DEGs across the four quadrants. Pixels represent the overlap between the transcriptome of each comparison as noted, with the significance of overlap [−log 10 (p value) of a hypergeometric test] color coded. Quadrants that were not significant to the analysis are shaded in gray. a Comparison of SUS versus RES DEGs in SH with vehicle versus CORT DEGs in WT (max −log 10 (p value) = 78); RES and vehicle: 738 DEGs; SUS and CORT: 795 DEGs. b Comparison of SUS versus RES DEGs in SH with vehicle versus CORT DEGs in BDNF het-Met (max −log 10 (p value) = 76); RES and vehicle: 636 DEGs; SUS and vehicle 522; SUS and CORT: 307 DEGs. c Comparison of SUS versus RES DEGs in EE with vehicle versus CORT DEGs in WT (max −log 10 (p value) = 90); SUS and vehicle: 667 DEGs. d Comparison of SUS versus RES DEGs in EE with vehicle versus CORT DEGs in BDNF het-Met (max −log 10 (p value) = 115); SUS and vehicle: 870 DEGs. Parallel colored markers indicate macro modules with converging GO terms across quadrants. e Representative image of the following threshold-free rank-rank hypergeometric overlap comparisons of DEGs. The direction of regulation in each quadrant that corresponds to each variable on each axis is described with an up or down arrow. The upper left quadrant designates co-downregulated genes, lower right quadrant designates co-upregulated genes, and the lower left and upper right quadrants include oppositely regulated genes (up-down and down-up, respectively). Genes along each axis are listed from greatest to least significantly regulated from the outer to middle corners. Genes are listed in Supplementary Table 1. Venn diagrams showed the common genes between experimental groups of the RRHO quadrants depicted in Fig. 2 corresponding to the point of highest overlap of each quadrant as described in Plaiser et al. [57] (see Supplementary Methods). f RES mice in SH and either WT mice (blue) or BDNF het-Met mice under vehicle (yellow), and between SUS in EE and either WT mice (purple) or BDNF het-Met mice under vehicle (coral), with 87 genes (Supplementary Data 2) shared across all comparisons (salmon); g SUS mice in SH and either WT (green) or BDNF het-Met mice (yellow) under CORT, with 165 (Supplementary Data 2) shared across both comparisons (lime). RRHO rank-rank hypergeometric overlap, DEG differentially expressed gene, WT wild-type, BDNF het-Met heterozygous BDNF Val66Met, CORT corticosterone, SI social interaction, RES resilient, SUS susceptible, SH standard housing, EE enriched environment, and GO gene ontology.

