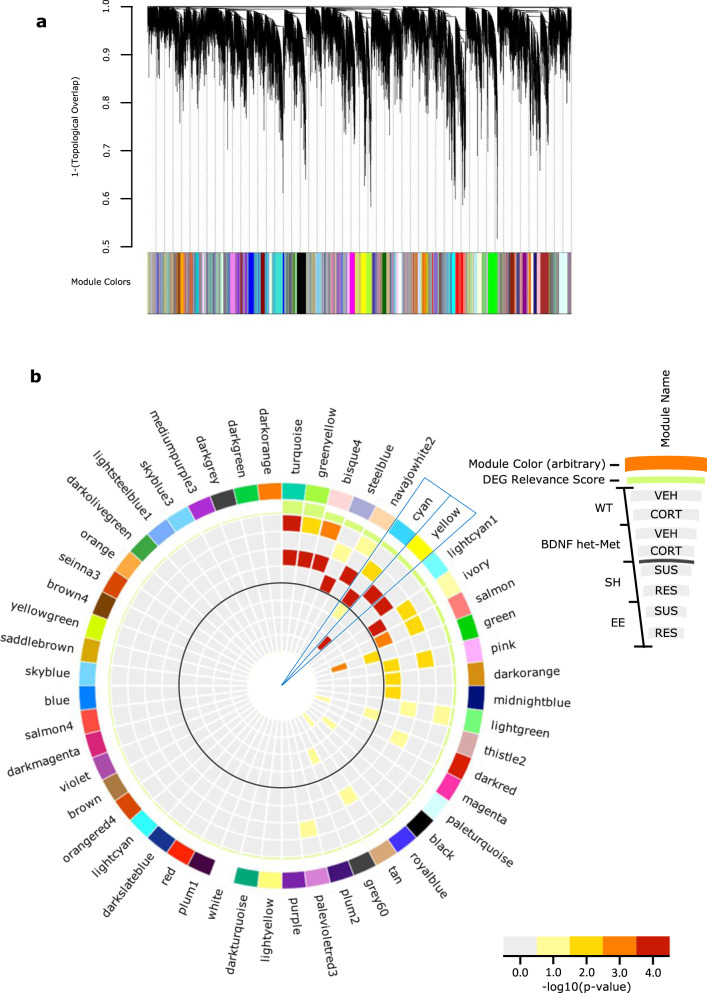
Fig. 3. Identification of shared-model co-expression networks and key modules.
a Consensus co-expression network analysis identified 54 coexpressed modules in both the CORT and CSDS experiments via hierarchal gene clustering on TOM-based dissimilarity and branch cutting using the top-down dynamic tree cut method. Each module is assigned a unique color identifier along the bottom of the dendrogram. Dendrograms demonstrate average linkage hierarchical clustering of genes based on the calculated topological overlap values. b Circos plot showing module name (ring 1), color (ring 2), a differential expression relevance score; calculated from the average enrichment of DEGs across all groups, with increasing bar height indicating increased average total enrichment (ring 3). Bar color indicates the significance for genes upregulated for each condition (vehicle compared to CORT, CORT compared to vehicle, SUS compared to RES, and RES compared to SUS) with warmer colors signifying increasing −log 10 (p value). The solid gray circle indicates the separation between the DEGs of the model of oral CORT in the outer shell and the DEGs of the model of differential housing before CSDS in the inner shell. The cyan and yellow modules are indicated as they have higher DEG average relevance, along with significant enrichment between models. WT VEH up (ring 4), WT CORT up (ring 5), BDNF het-Met VEH up (ring 6), BDNF het-Met CORT up (ring 7), SH SUS up (ring 8), SH RES up (ring 9), EE SUS up (ring 10), and EE RES up (ring 11). CORT corticosterone, CSDS chronic social defeat stress, TOM topological overlap matrix, DEG differentially expressed gene, WT wild-type, BDNF het-Met heterozygous BDNF Val66Met, VEH vehicle, RES resilient, SUS susceptible, SH standard housing, and EE enriched environment.

