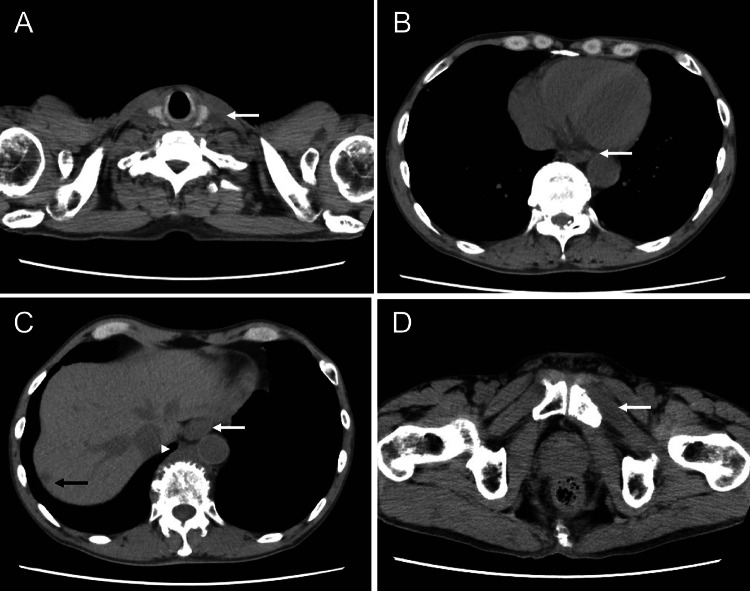
Fig. 6.
CT performed after two course of chemotherapy showed a decrease in tumor diameter. A Swollen left supraclavicular lymph nodes (9 mm, arrow) decreased when compared with before chemothrapy. B, C Wall thickening of the lower thoracic esophagus (white arrow) along with decreasing paraesophageal lymph nodes (20 mm, white arrowhead) and liver metastasis (9 mm, black arrow). D Decreasing tumor infiltrating the left pubis (white arrow)

