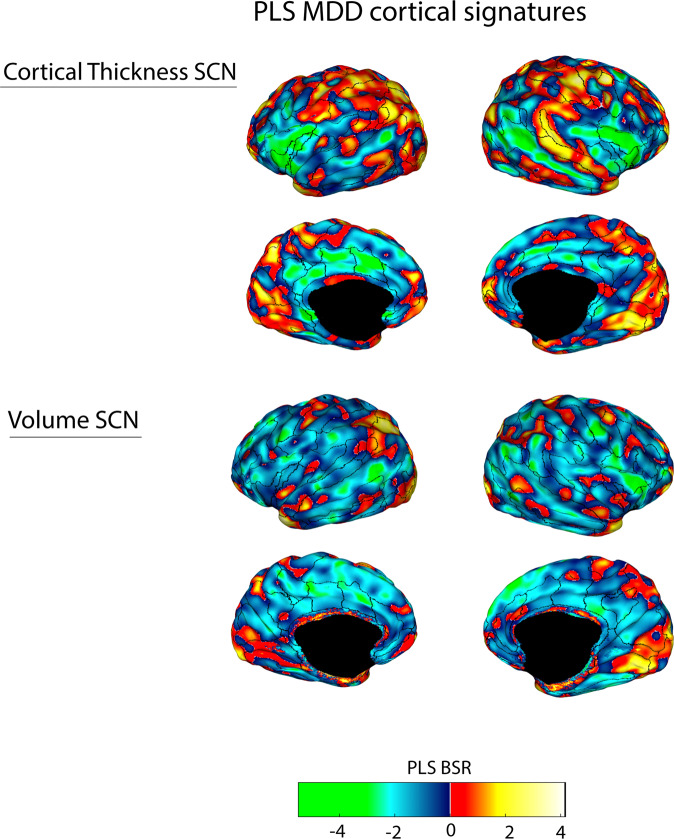
Fig. 1. A PLS-derived structural covariance network (SCN) of cortical regions that significantly and reliably distinguished persons with MDD from HC for cortical thickness (top panel) and gray matter volume (bottom panel), and consistently involved the anterior insula, medial prefrontal cortex, anterior and posterior cingulate gyrus, DLPFC cortex, and lateral temporal lobe (superior temporal sulcus).
Brighter colored regions (green and yellow) represent regions that robustly contributed to the network patterns. Vertices that had Bootstrap Ratio (BSR) values with large magnitudes reflected a large contribution to the network pattern (i.e., had a small standard error and a large weight/salience) that was stable across subjects. Superimposed ROIs are derived from the Freesurfer Destrieux atlas [64].

