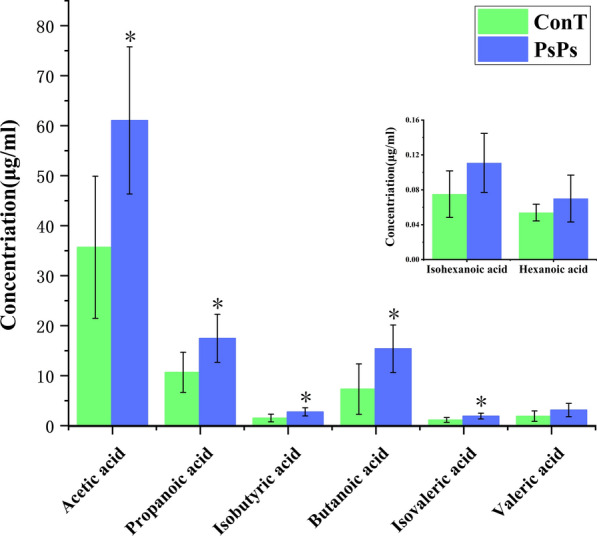
Fig. 4.

Changes of SCFAs concentration in feces of mice 3 weeks after PsPs intragastric administration. The Y-axis is the concentration of SCFAs in the samples determined by GC, in units of (ug/ mL), and all samples determined have the same weight

Changes of SCFAs concentration in feces of mice 3 weeks after PsPs intragastric administration. The Y-axis is the concentration of SCFAs in the samples determined by GC, in units of (ug/ mL), and all samples determined have the same weight