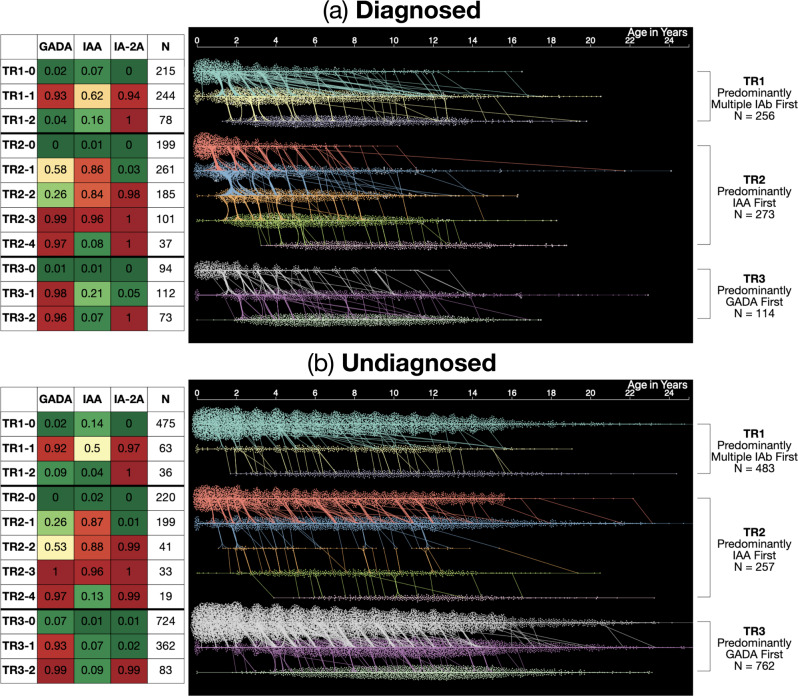
Fig. 1. Three data-driven islet autoantibody trajectories towards type 1 diabetes.
The three trajectories discovered by the 11-state Hidden Markov model for (a) Diagnosed (D, 643 participants who were diagnosed with type 1 diabetes) and (b) Undiagnosed (UD, 1502 participants who were not diagnosed with type 1 diabetes during follow-up). Probabilities of islet autoantibody positivity for each of the 11 states are described in the table on the left, showing probabilities of each islet autoantibody for each state in text and color (heat map scale: green: 0, red: 1). Waterfall diagrams on right show visits (dots), HMM states (y-axis & color) of participants over time in years (x-axis). The three trajectories were characterized with respect to their first islet autoantibody positive states, respectively: TR1 Predominantly Multiple IAb first (256 P, 483 NP); TR2 Predominantly IAA first (273 P, 257 NP); TR3 Predominantly GADA first (114 P, 762 NP). Source data are provided as a Source Data file.

