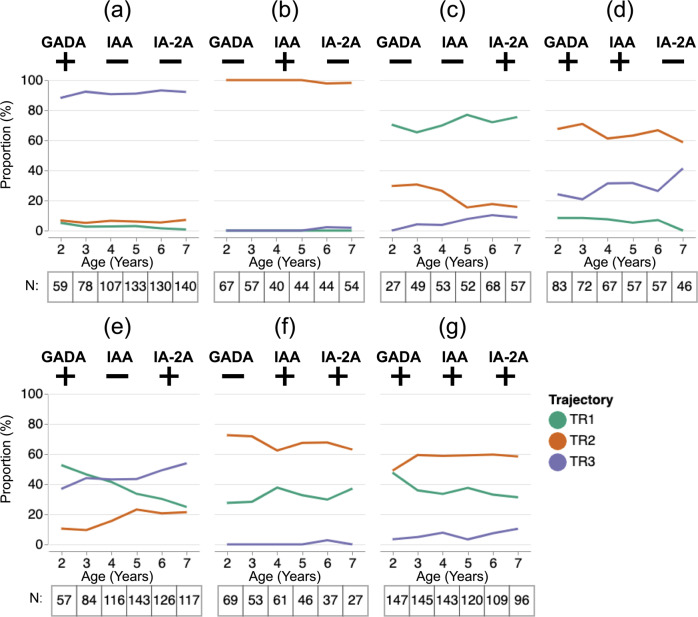
Fig. 3. Proportion of participants in the three trajectories given islet autoantibody pattern and age.
Proportion (y-axis) of participants with each of seven possible IAb patterns (a–g) belonging to each trajectory (TR1: green, TR2: red, TR3: purple) over the ages between 2 and 7 (x-axis). Tables under each panel show the number of subjects who had the given IAb pattern at each corresponding age. Source data are provided as a Source Data file.

