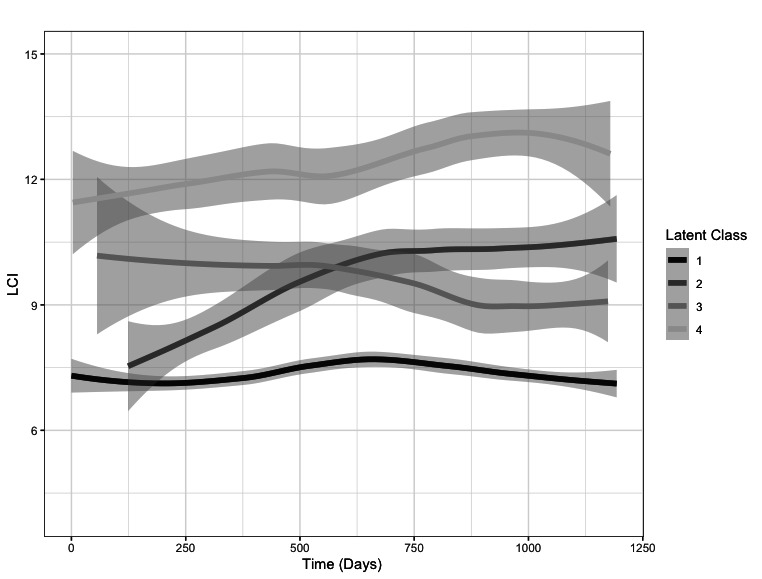
Figure 4.

Clustering of longitudinal lung clearance index (LCI) data performed using latent class growth analysis. The graph shows the best-fit solution of four clusters, with central and grey bands representing the mean and 95% CI of the cluster trajectories. Time from first measurement is shown on the x-axis. Latent class clusters 1-4 are described in the text and in table 2. Individual patient trajectories are presented in online supplemental figure E6.
