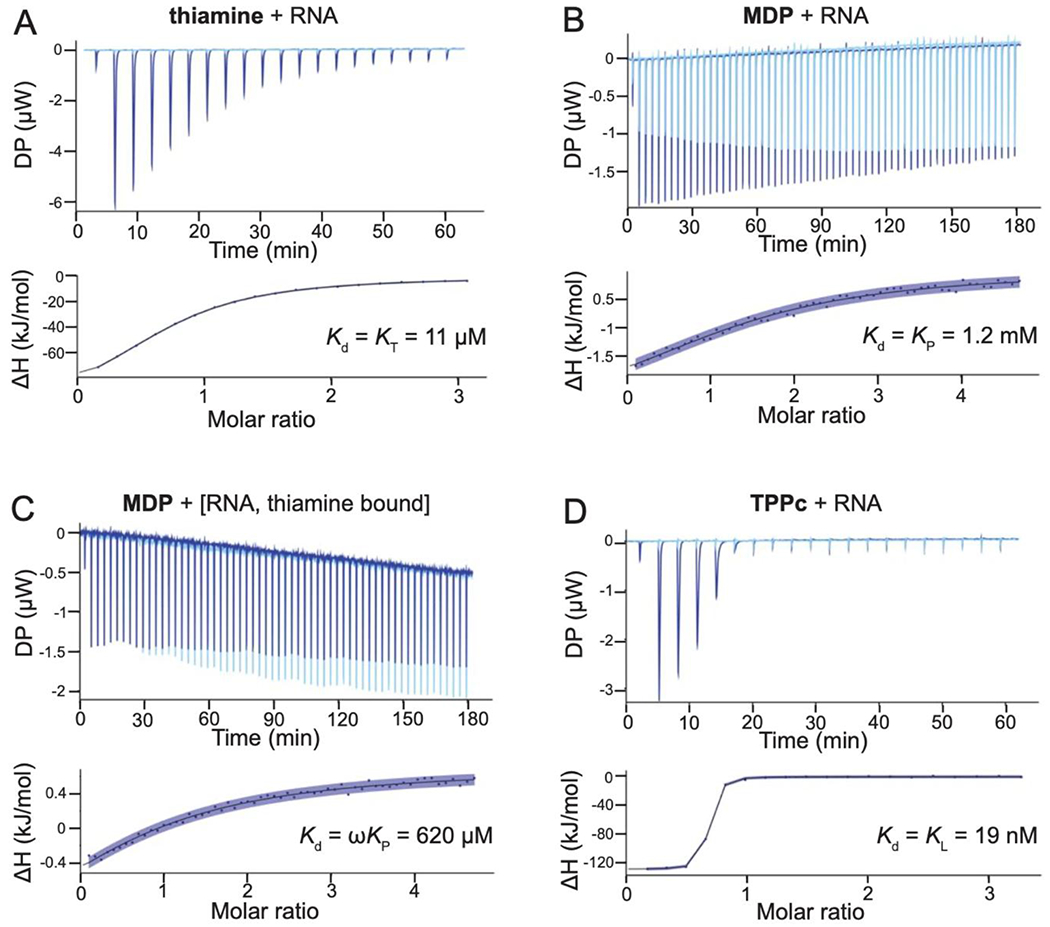
Figure 2.

RNA ligand affinities determined by isothermal titration calorimetry. ITC traces obtained upon titration of (A) thiamine into the riboswitch, (B) MDP into the riboswitch, (C) MDP into the thiamine-bound riboswitch, and (D) TPPc into the riboswitch. Background traces (ligand titrated into buffer) are shown as light blue, experimental traces in dark blue. Curve fits are shown with the 95% confidence intervals in blue shading. Experimental steps taken to obtain accurate data for weak binding ligands are detailed in the Methods.
