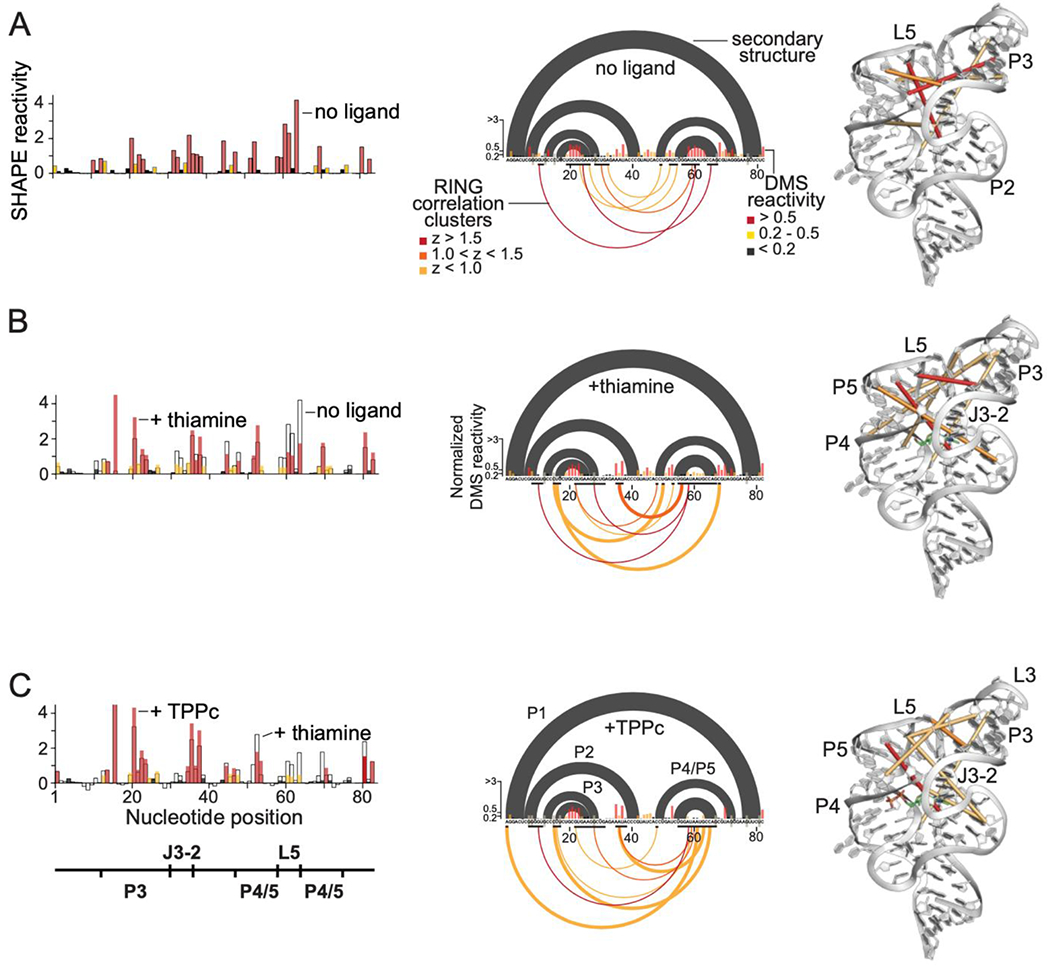
Figure 4.

Solution probing of secondary and tertiary structures of the TPP riboswitch bound to thiamine and to TPPc. Left to right: SHAPE reactivity profiles, RING-MaP data, and RING correlation cluster centroids plotted on the three-dimensional TPP riboswitch structure for (A) TPP riboswitch RNA alone, (B) thiamine-bound riboswitch, and (C) TPPc-bound riboswitch. SHAPE reactivities for each complex are labeled. For RING-MaP data, accepted secondary structure (black arcs) and DMS reactivities (histograms) are shown above the x-axis. Below the axis, black bars denote nucleotides comprising a cluster; arcs link the centroid nucleotides of a given cluster, colored by z-score.
