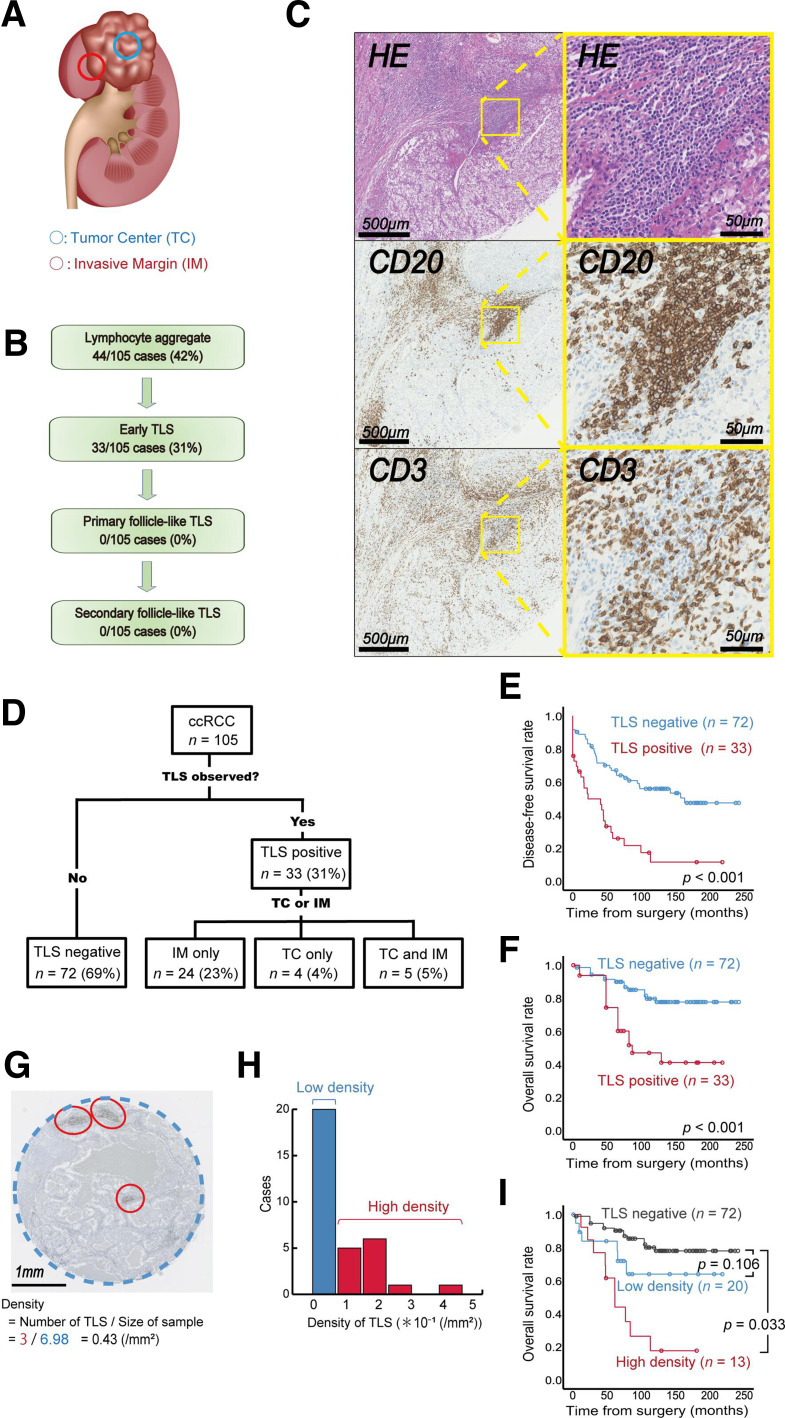
Figure 1.
Quantitative tertiary lymphoid structure (TLS) analysis and impact on kidney cancer prognosis. (A) Schematic illustration of the regions of interest in the TLS analysis of clear cell renal cell carcinoma (ccRCC). (B) Summary of TLS detection in tumors from 105 patients with ccRCC. (C) Representative image of TLSs in serial sections with immunolabeling for CD20/CD3 and H&E staining. Zoomed-in images are of the indicated boxed regions. (D) Summary of the TLS distribution in tumors from 105 patients with ccRCC. (E–F) Kaplan-Meier survival curves for disease-free (E) and overall survival rates (F) in 105 ccRCC patients following surgery according to TLS status. (G) Tumor area occupied by TLSs. (H) Histogram of TLS density according to the occupied tumor area in 105 ccRCC patients. (I) Kaplan-Meier survival curves for overall survival in 105 ccRCC patients following surgery according to TLS density. The p value was obtained from the log-rank test.

