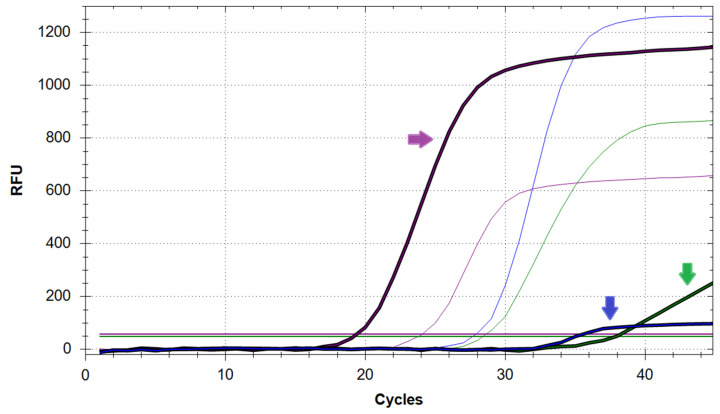
Figure 5.
Saliva sample (bold curves) showing sub-optimal amplification of both N (green arrow) and E (blue arrow) genes but successful amplification of RNase P (purple arrow). Correct amplification of all three targets from the control sample is also shown (thin curves). The horizontal lines represent the RFU threshold for each target.

