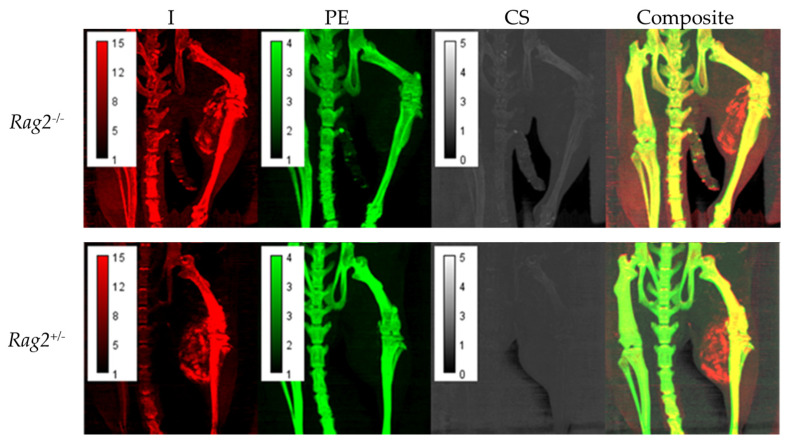
Figure 3.
Maximum intensity projections (MIPs) of the decomposition maps for Rag2−/− and Rag2+/− mouse demonstrating intratumoral nanoparticle accumulation and iodine enhancement as well as the overall quality of the decomposition results. Each pixel in these images represents the maximum voxel value across a projection through a given number of slices. In this case, we have chosen 20 coronal slices to capture the tumor vasculature.

