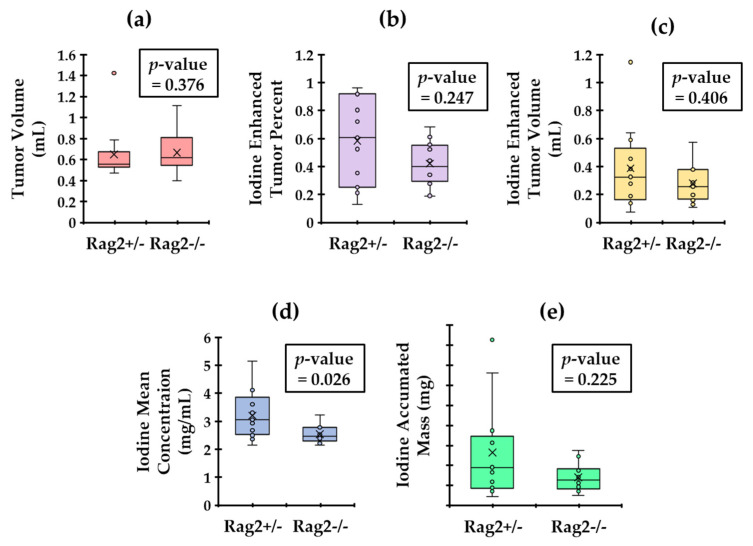
Figure 4.
Calculated tumor metrics with the associated p-value from an unpaired Wilcoxon–Mann–Whitney test. We display the comparison of tumor volume (a). We also show plots of the Iodine enhanced tumor volume (b), the enhanced tumor percentage (c), the mean iodine concentration (d) and the iodine accumulated mass (e) in tumors. Only the mean iodine concentrations are significantly different between the two genotypes (p < 0.05).

