
Figure 1.
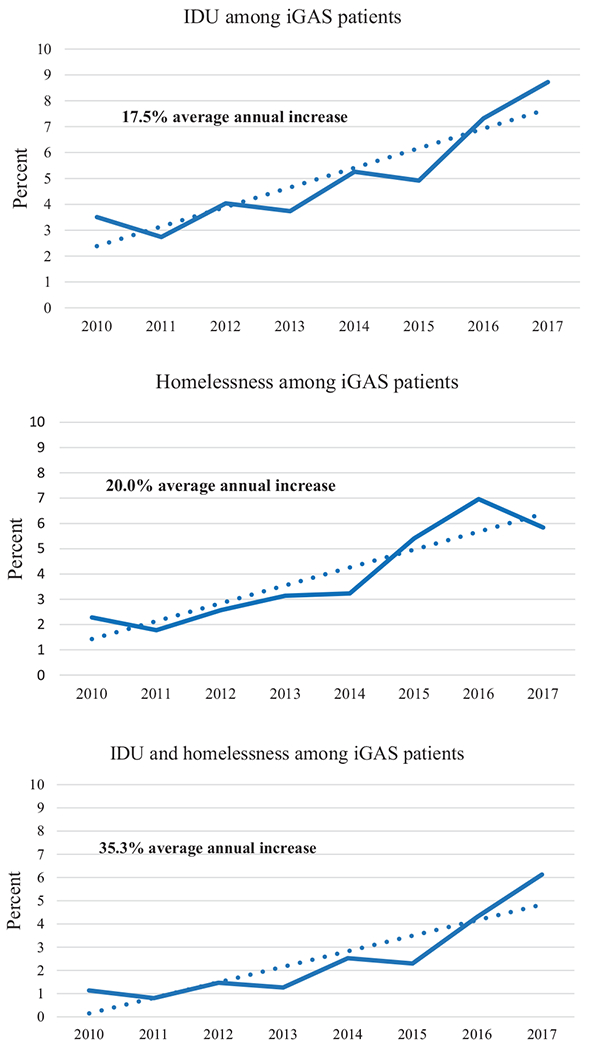
Prevalence of Injection Drug Use (IDU), Homelessness, or Both Among iGAS Patients--Active Bacterial Core surveillance, 2010–2017. Dotted lines indicate average annual increase in prevalence of the risk factor. Solid lines indicate percent of cases for which the risk factors was noted, by year.