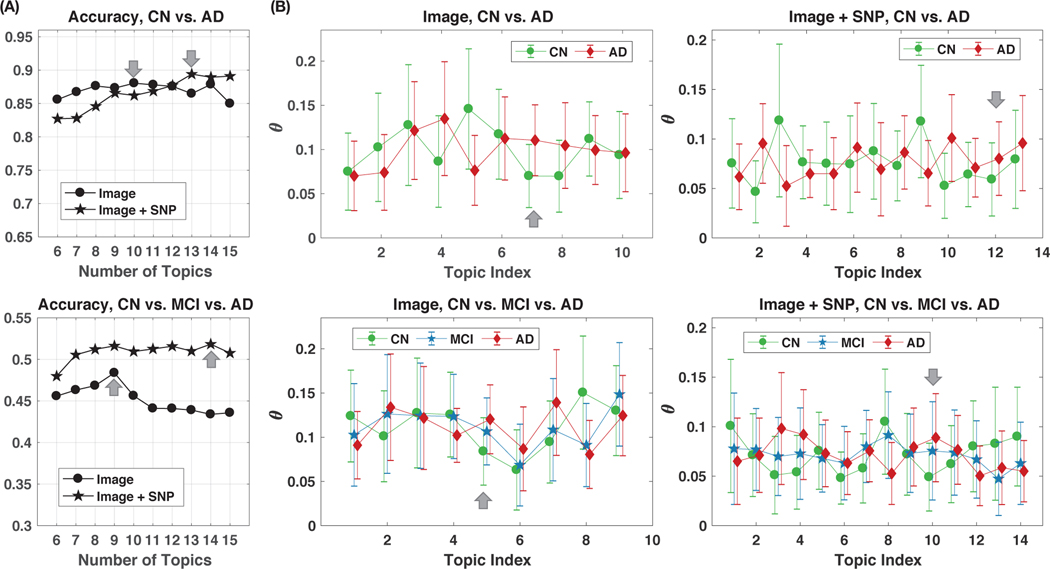
Fig. 2:
Illustrations of topic proportions θ estimated from sLDA models, and the classification accuracies. (A) Classification accuracy of diagnosis groups versus number of topics: (top) CN vs. AD classification task, (bottom) CN vs. MCI vs. AD classification task. Grey arrows indicate the selected optimal numbers of topics K* in each setting. (B) Estimated topic proportions θ (mean ± standard deviation) in different diagnosis groups when modeling with image features only or with both image and genetic features. Numbers of topics are determined by the highest classification accuracy in Fig. 2 (A). Grey arrows point to the discriminative topics that are visualized and interpreted later (as in Fig. 3 (A)).

