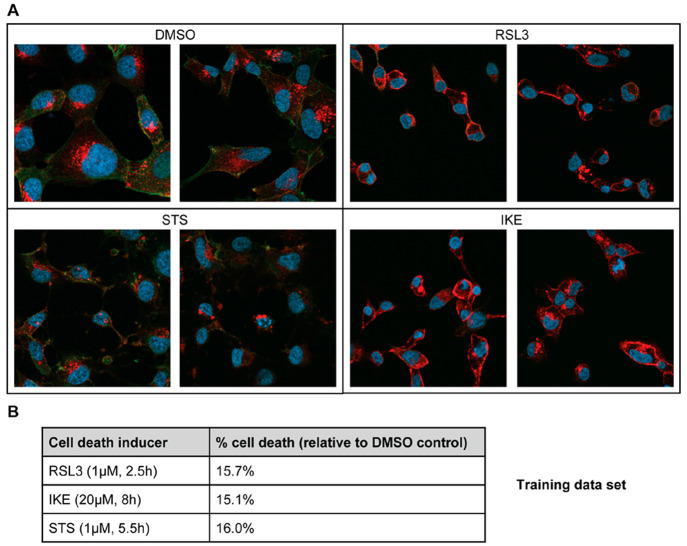
Figure 1.
Images undergoing different cell death modalities for machine learning analysis. (A) HT-1080 cells were incubated with ferroptosis inducers RSL3 (1 μM) or IKE (20 μM), apoptosis inducer STS (1 μM), or DMSO control. Nuclei were stained with DAPI (blue). TfR1 was labeled with 3F3-FMA and Alexa Fluor 594 secondary antibody (red). F-actin was labeled with FITC-phalloidin (green). Images were captured using a Zeiss LSM800 confocal microscope at 63×/1.40 oil DIC objective. For each treatment, representative images from the training data set are depicted. (B) In parallel with the immunofluorescence experiments, CellTiter-Glo viability assays were used to monitor the percentage cell death for each treatment, and cells were fixed when percentage cell death reached 10–20%. The concentrations and time points that resulted in this extent of cell death in each set are listed for each treatment.

