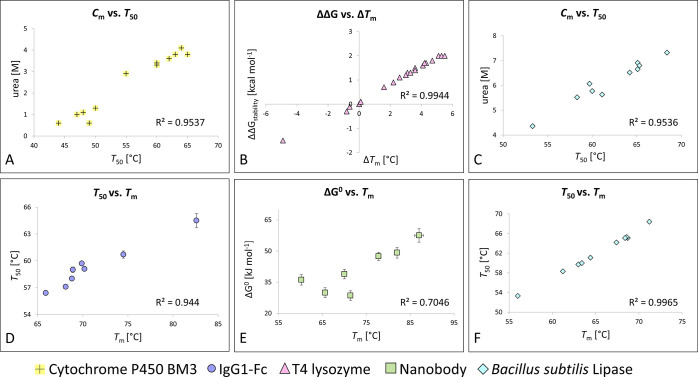
Figure 1.
Correlations between different stability parameters. (A) Correlation between Cm and T50 for cytochrome P450 BM3 variants.24 (B) Correlation between ΔΔG and ΔTm for T4 lysozyme mutants.25 (C, F) Correlations between (C) Cm and T50 and (F) T50 and Tm for Bacillus subtilis lipase mutants.1 (D) Correlation between T50 and Tm for IgG1-Fc variants.26 (E) Correlation between ΔG° and Tm for disulfide variants of the nanobody cAbBCII10.27

