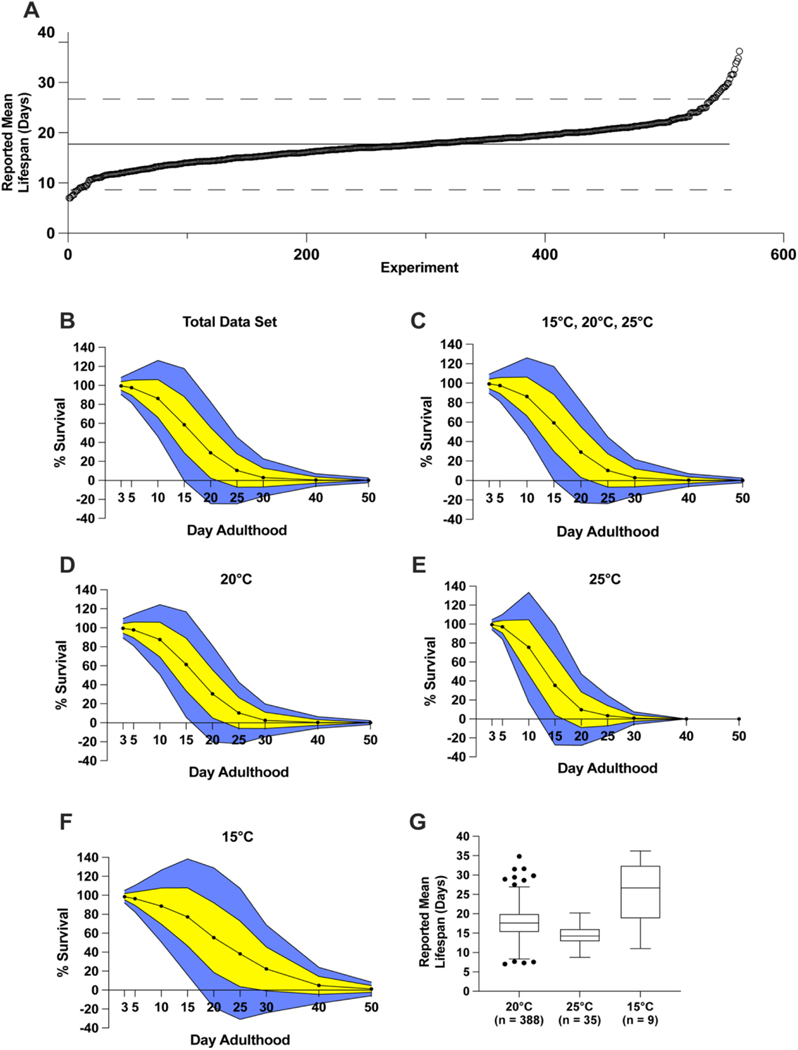
Fig. 2.
Variability of N2 lifespans in the published literature.
A. Reported mean lifespan of all entries in the data set. Average reported N2 lifespan was 17.7 days, as represented by the solid black line. Each circle represents an individual experiment. Dashed line indicates two standard deviations from the mean. B–F. Average lifespan on the respective day for the total data set (B), combination of assay conditions 1, 2, and 5 in Table 1 (C), and respective individual assay conditions (D–F). Yellow indicates 1 standard deviation from the mean; blue represents 2 standard deviations from the mean. Survival above 100% and below 0% is not physiologically possible. G. Tukey-method boxplot for experiments at 20 °C, 25 °C, and 15 °C (assay conditions 1, 2, and 5, respectively, from Table 1). (For interpretation of the references to colour in this figure legend, the reader is referred to the web version of this article.)

