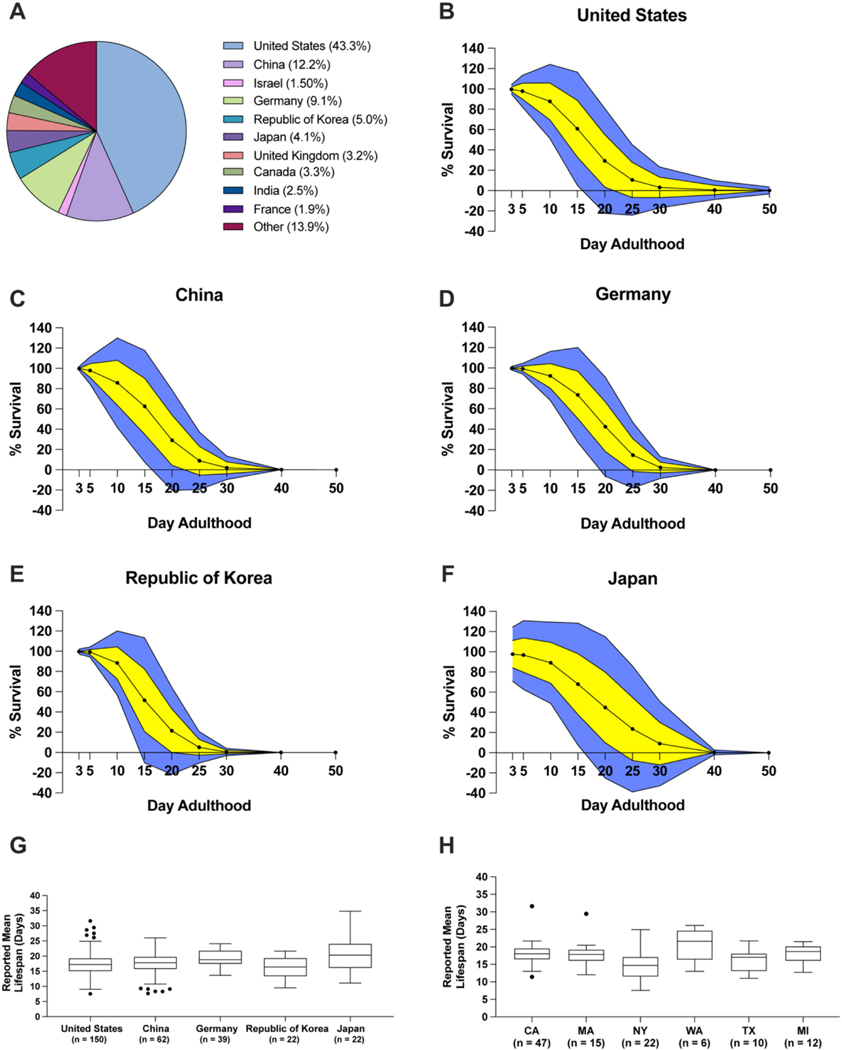
Fig. 5.
Distinct geographic locations show differences in N2 lifespan.
A. Analysis of countries experiments were performed in the entire dataset. B–F. Average survival curves for the United States (B), China (C), Germany (D), Republic of Korea (E), and Japan (F) at 20 °C on solid NGM. Yellow indicates 1 standard deviation from the mean and blue indicates 2 standard deviations from the mean. Survival above 100% and below 0% is not physiologically possible. G-H Tukey-method boxplots of the reported mean N2 lifespans of different countries (G) and states of the United States (H). CA: California; MA: Massachusetts; NY: New York; WA: Washington; TX: Texas; MI: Michigan. (For interpretation of the references to colour in this figure legend, the reader is referred to the web version of this article.)

