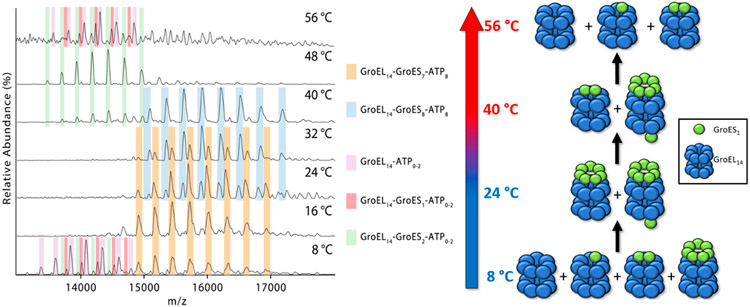
Figure 4.
Mass spectra showing the region corresponding to the GroEL–GroES complexes formed in solution E (Table 1 solution “E” 120 nM GroEL, 12 μM GroES, 25 μM Mg2+, and 50 μM ATP in 200 mM EDDA). The accompanying illustration summarizes the observed products formed upon heating solution “E” at temperatures of 8–56 °C. Lower temperatures (8 °C) GroEL14–GroESy (y = 0–2) products are formed, whereas GroEL14–GroES7 and GroEL14–GroES8 products are formed at higher temperatures. At T >40 °C the observed species revert back to the lower mass complexes, which become the most abundant products at 48–56 °C.

