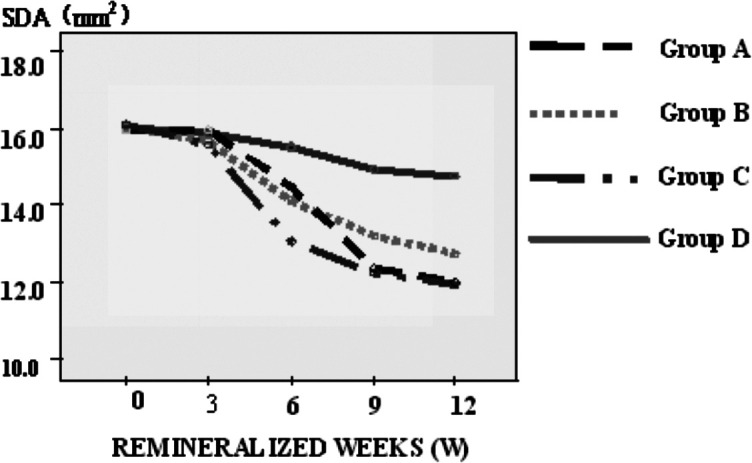
Figure 3.

Comparison of the SDA at different times in the four groups: The SDAs in the four groups all declined with time, and the rates of decline were relatively low in the first 3 weeks. There was a rapid declining period in Group A from the 6th week to the 9th week.
