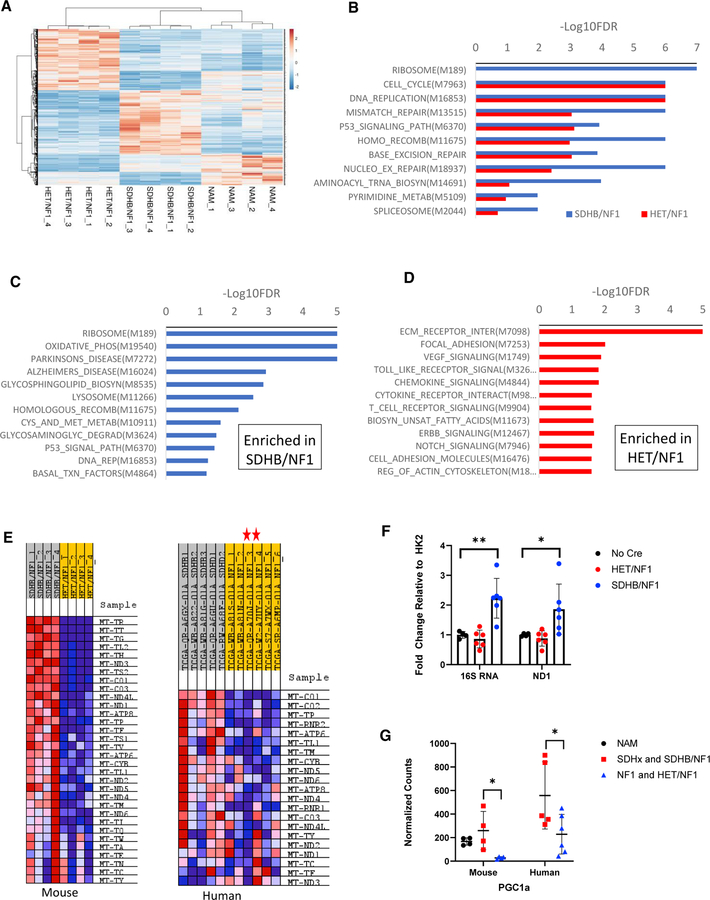
Figure 6. Transcriptomics of mouse tumors revealed enrichment of mitochondrial and ribosomal gene transcripts.
(A) Heatmap and hierarchical clustering of top 1,200 most significantly up- and down-regulated transcripts between SDHB/NF1 and HET/NF1 tumor groups.
(B) KEGG gene set enrichment for SDHB/NF1 and HET/NF1 tumors relative to normal adrenal medulla. Plotted pathways had p < 0.01. Depicted pathways were the top 10 most enriched KEGG pathways in SDHB/NF1 tumors and their relative enrichment in HET/NF1 tumors. Numbers in parentheses are the systemic names for each KEGG pathway.
(C) KEGG gene set enrichment for SDHB/NF1 tumors relative to HET/NF1 tumors. Depicted pathways had p value < 0.03.
(D) KEGG gene set enrichment for HET/NF1 tumors relative to SDHB/NF1 tumors. Depicted pathways had p value < 0.01.
(E) Heatmap showing enrichment of mitochondrial DNA-encoded transcripts in mouse and human tumors. Red stars indicate the two NF1 pheochromocytomas, which were classified as pseudohypoxic.
(F) Quantification of mitochondrial DNA copy number by qPCR analysis (16S RNA and ND1/HK2) from mouse tumors and NAM (n = 4–6).
(G) Normalized counts of transcripts for PPARGC1a gene (PGC1a) from mouse and human tumors and mouse NAM. Data ae presented as mean ± SD and analyzed using an unpaired t test. **p < 0.01.

