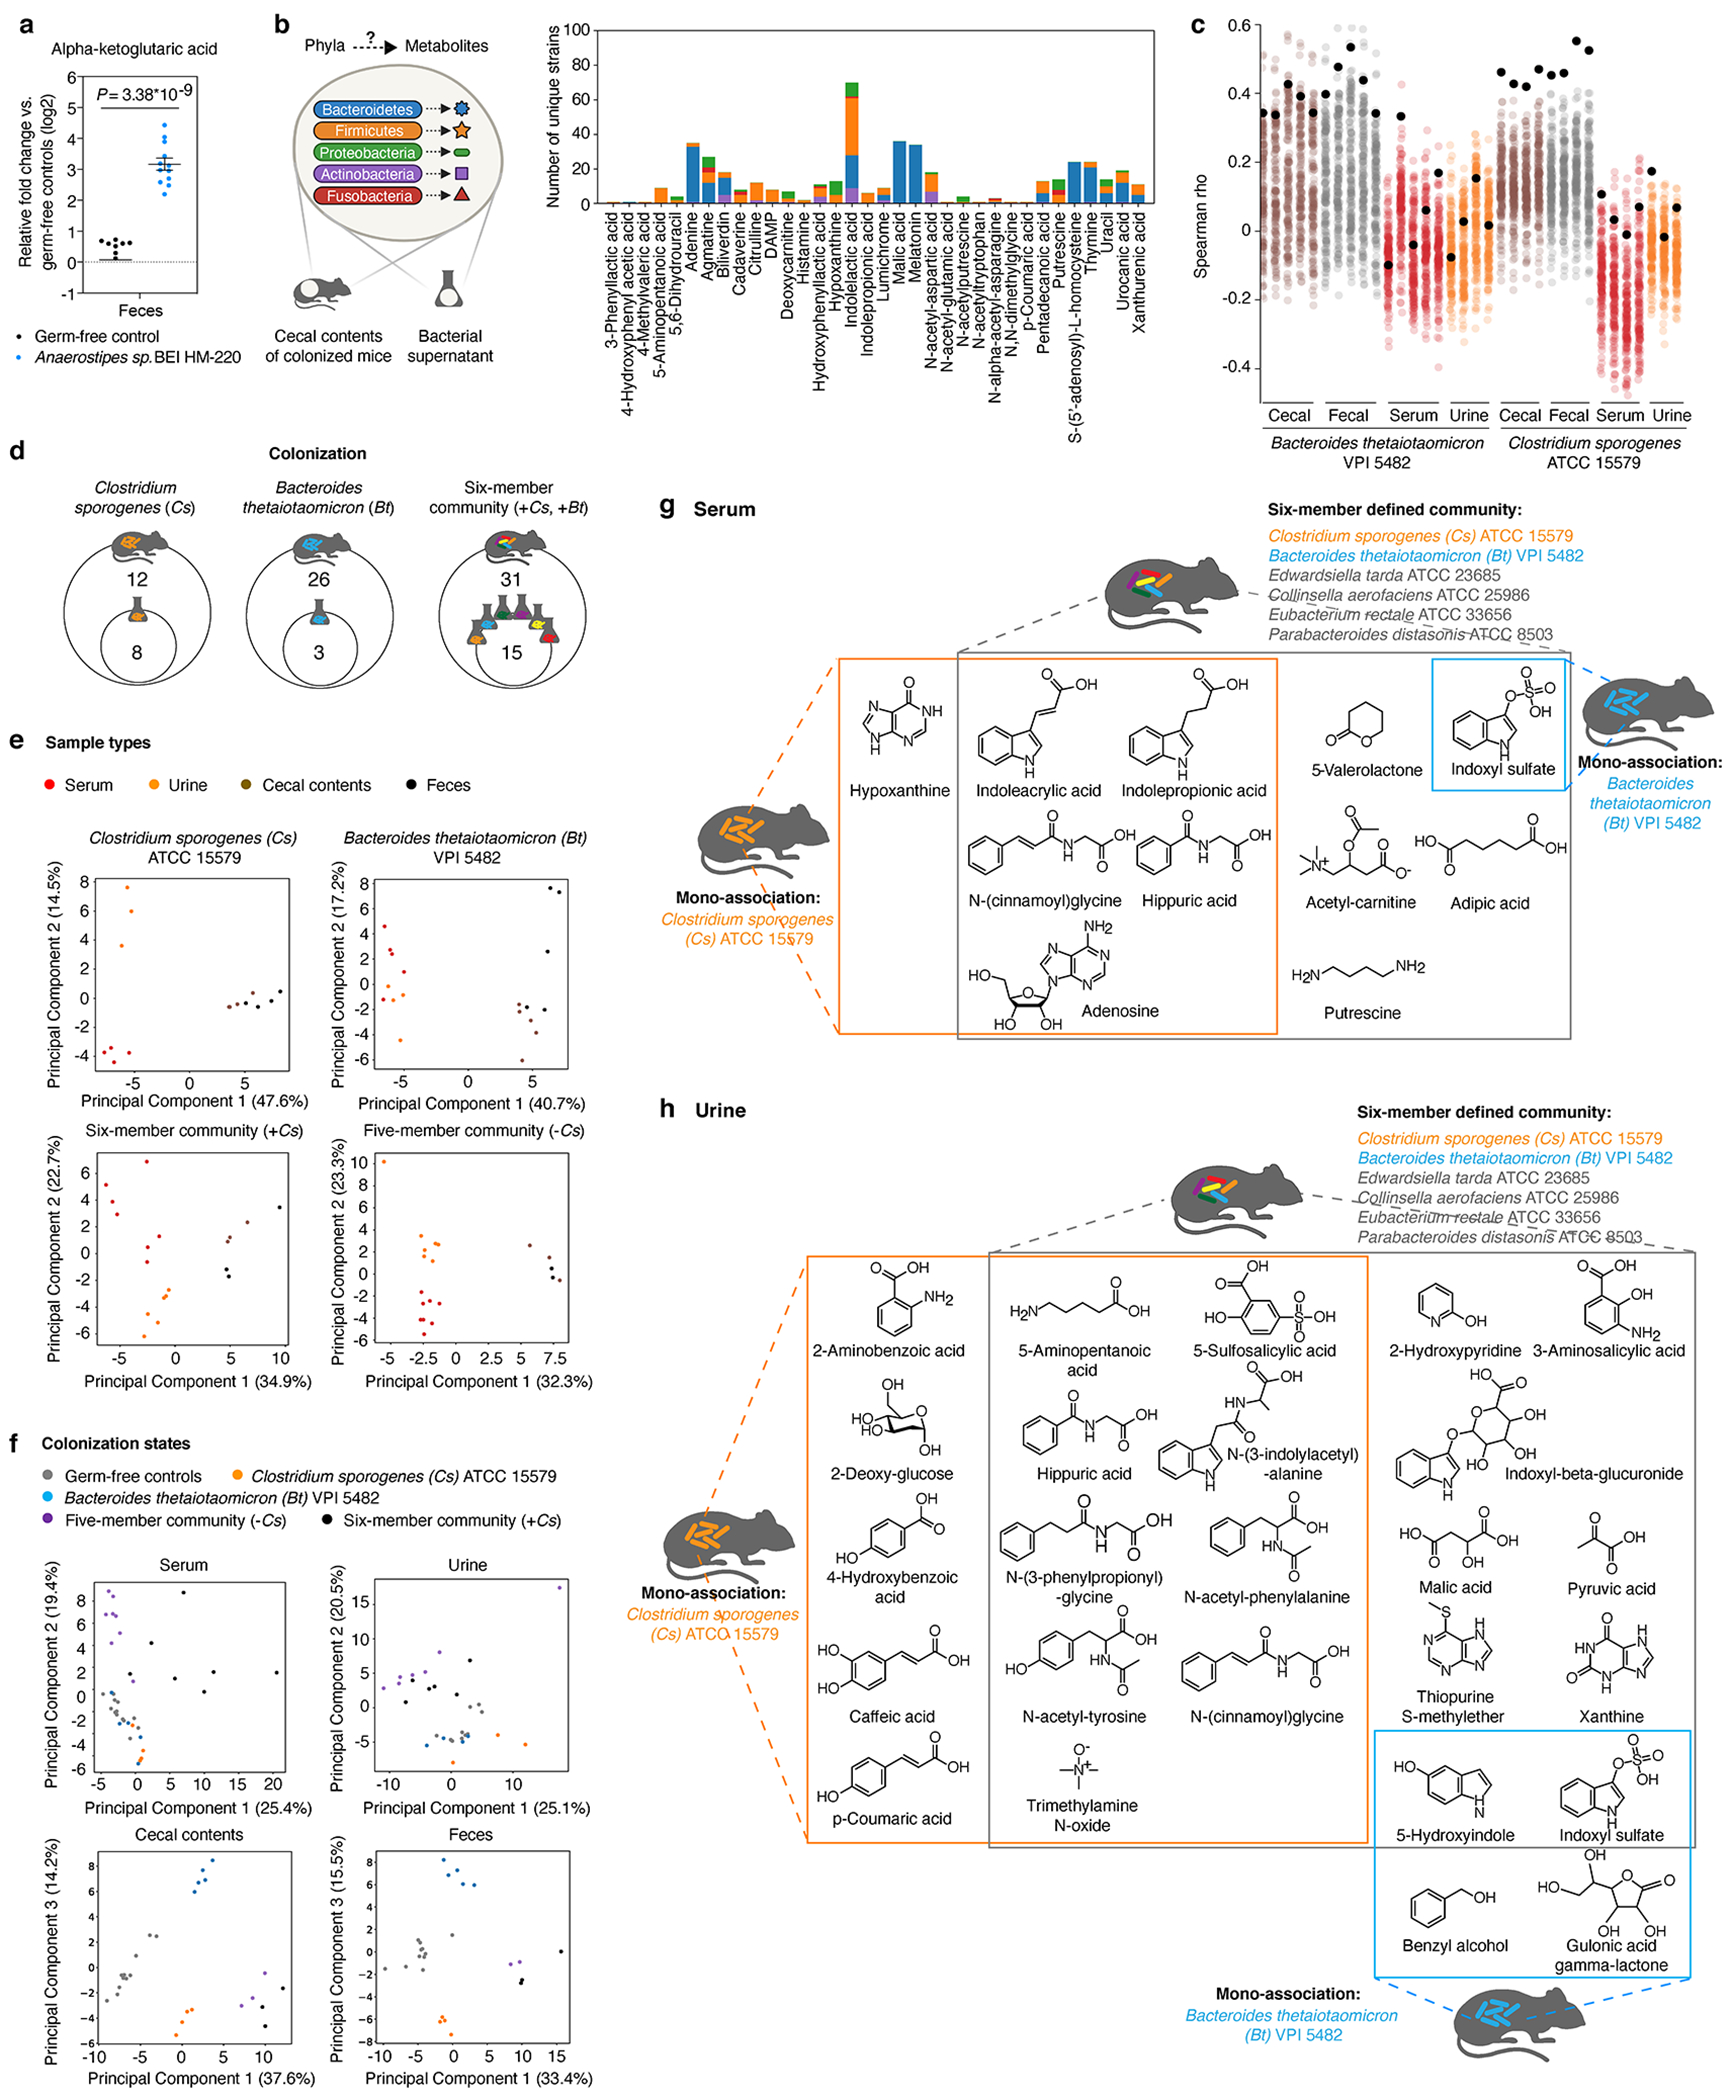
Extended Data Fig. 9, Metabolic contribution by individual gut microbes in a multi-species community.

a, Alpha-ketoglutaric acid levels in feces of mice mono-colonized with Anaerostipes sp. BEI HM-220. Mean ± s.e.m. of two independent experiments, each with n = 4 mice (germ-free) or n = 5 or 7 mice (Anaerostipes mono-colonized). b, Left panel: MDMs were associated with specific bacterial phyla leveraging both in vivo and in vitro metabolomic data. Right panel: Number of mega-medium grown bacterial strains by phylum that produce MDMs identified in the cecal contents of mice colonized with Bacteroides thetaiotaomicron (Bt, n = 5), or Clostridium sporogenes (Cs, n = 3), or a six-member community (n = 3). Number of strains that produce at least one of these metabolites in vitro by phylum: Bacteroidetes: n = 52, Firmicutes: n = 60, Proteobacteria: n = 8, Actinobacteria: n = 16, and Fusobacteria: n = 3. Each metabolite shown was significantly produced both in vitro and in vivo (≥ 4-fold, corrected P < 0.05). Uniquely detected (non-coeluting) metabolites are shown (Supplementary Table 9) .c, Spearman correlation between metabolomic profiles (standardized and scaled, log2-transformed, fold-change data) of individual Bt- or Cs-mono-associated host biofluids (cecal contents, feces, serum, or urine) and individual bacterial culture (158 mega-medium grown). Colored dots: Spearman’s rho values calculated by comparing metabolomic profiles of individual bacterial culture vs. individual biofluid of either Bt- or Cs-mono-associated mice. Black dots: Spearman’s rho calculated using metabolomic profiles of Bt or Cs, the same strains used for mono-association in mice. d, Venn diagram of overlapping metabolites that are significantly produced (≥ 4-fold, corrected P < 0.05) in culture and in the cecum of colonized mice. e, Principal component analysis (PCA) separates metabolomic profiles of identified metabolites by sample type in each colonization state. P values on metabolomic profile comparisons between different sample types of the same colonization state were determined using PERMANOVA: six-member community (P = 0.073), and all other colonization states (P = 0.001). f, PCA separates metabolomic profiles of identified metabolites by colonization states. P values on metabolomic profile comparisons between different colonization states of the same sample type were determined using PERMANOVA: P = 0.001 for all four sample types. g, h, Example chemical structures of significantly produced metabolites (≥ 4-fold, corrected P < 0.05) in serum (g) or urine (h) by each colonization state corresponding to Fig. 4b. P values in a, b, d, g, h: two-tailed t-test with Benjamini-Hochberg correction for multiple comparisons.
