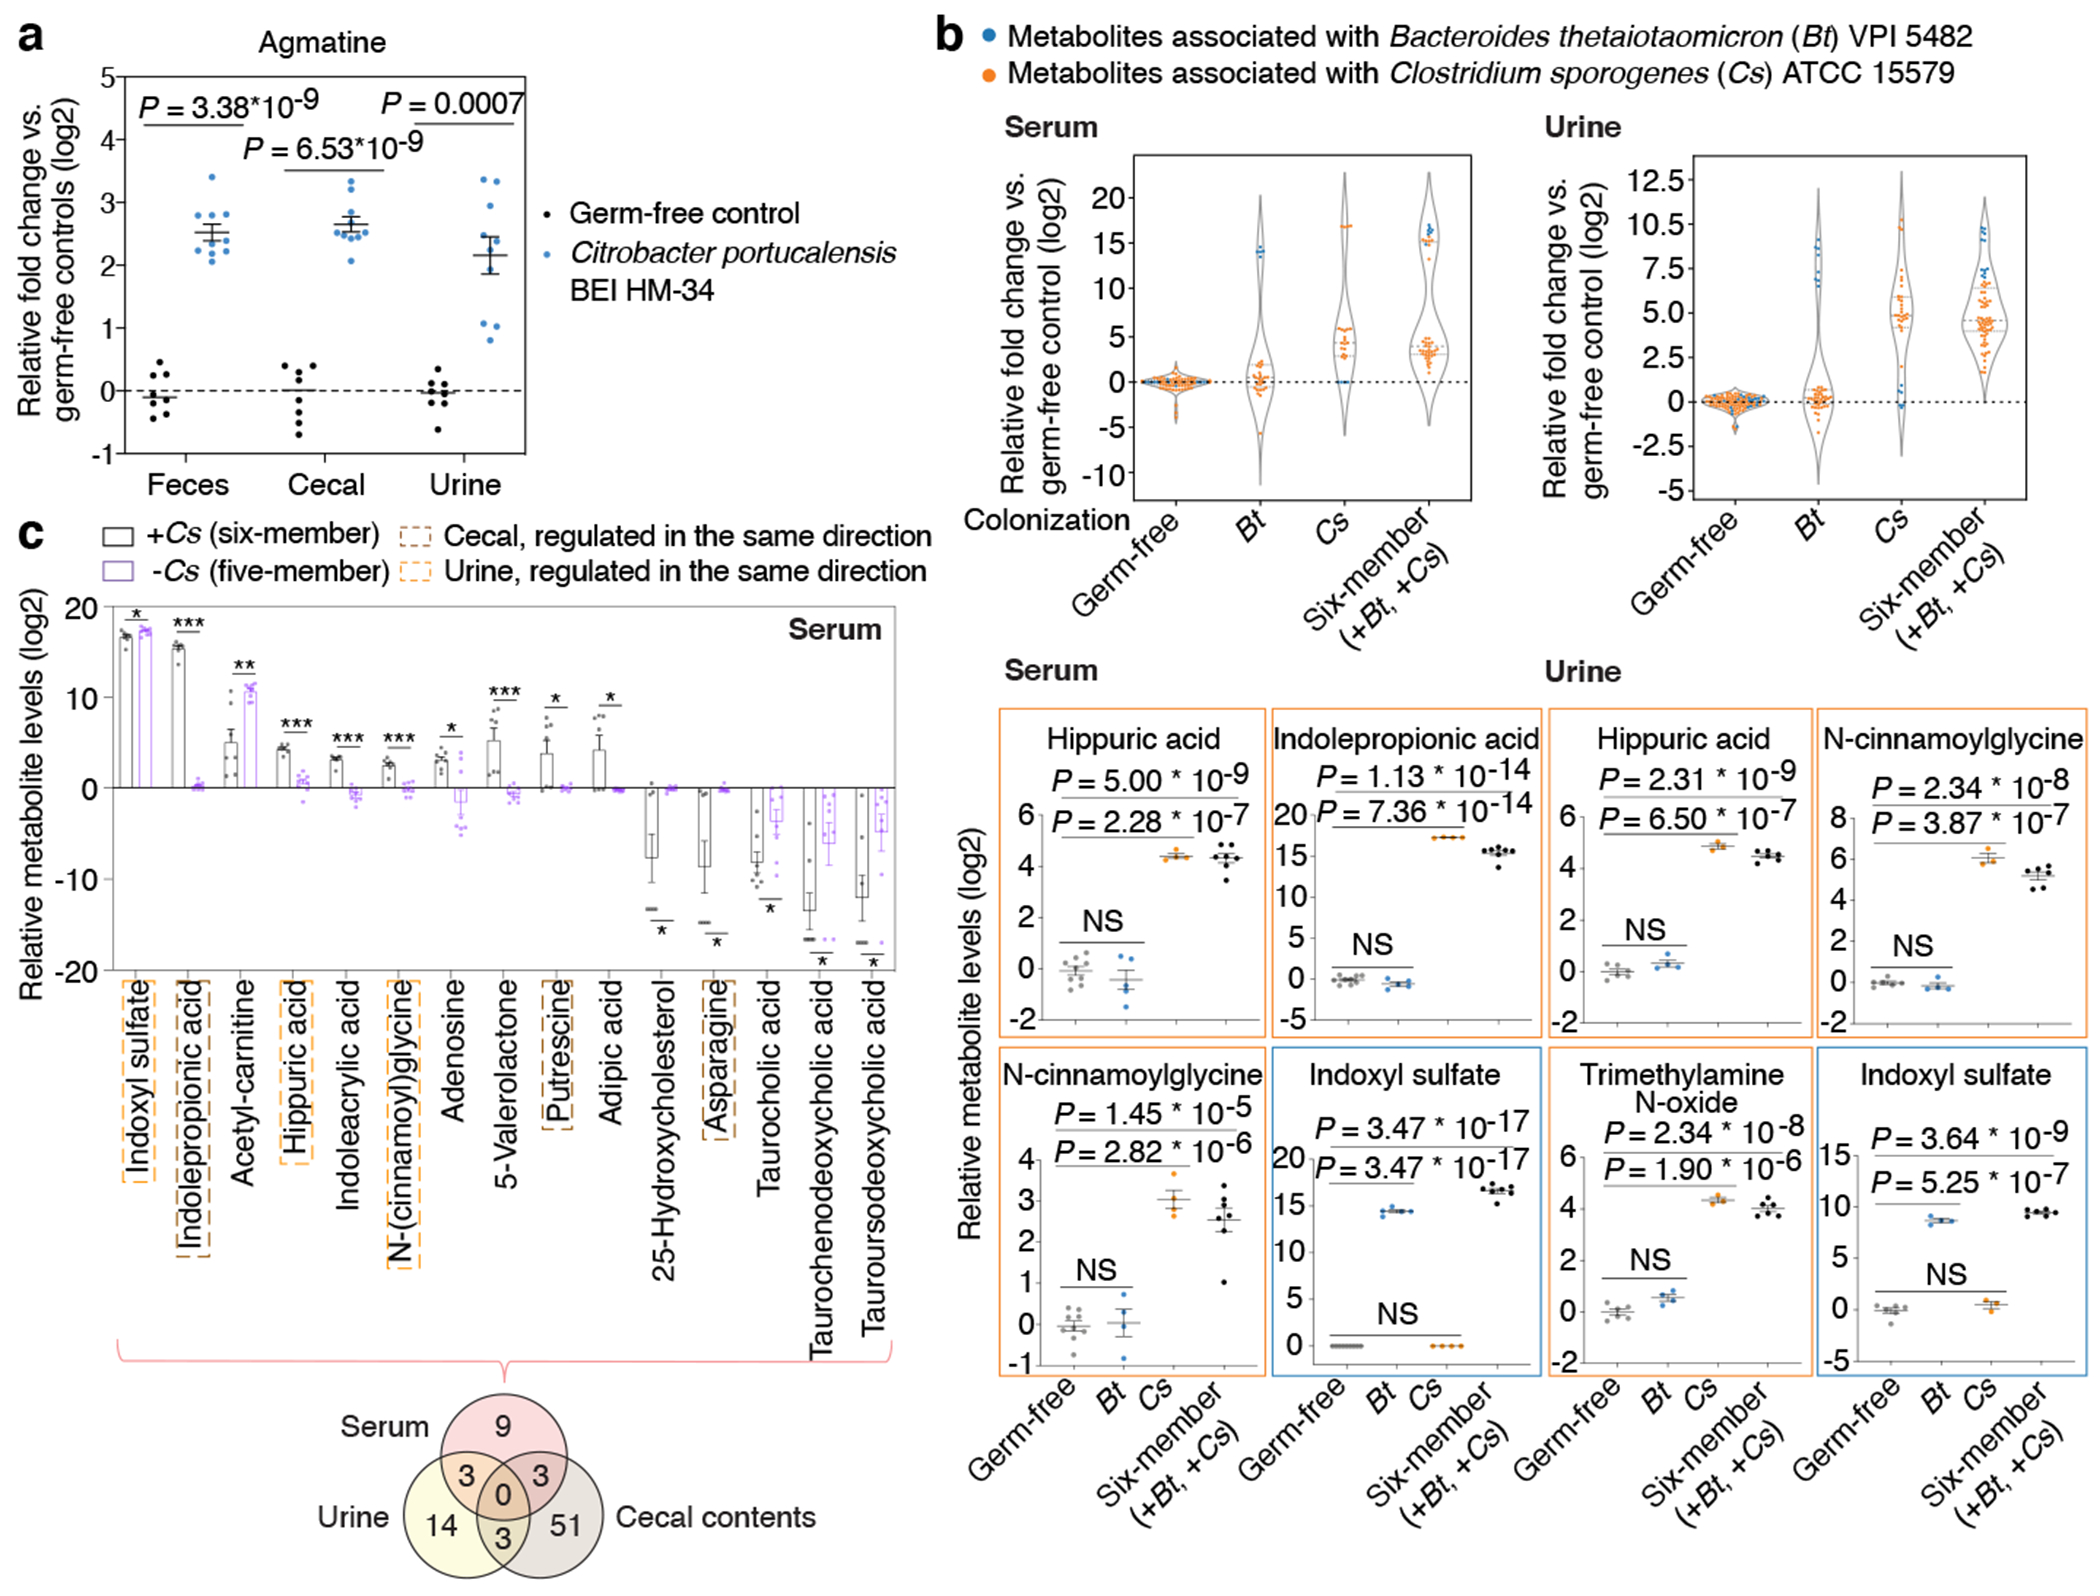
Fig. 4, Metabolic contribution by individual gut microbes in a multi-species community.

a, Quantification of agmatine levels. Mean ± s.e.m. of two independent experiments, each with n = 4 (germ-free) or n = 5 (Citrobacter mono-colonized) individual mice. b, Significantly produced metabolites associated with Clostridium sporogenes (Cs) or Bacteroides thetaiotaomicron (Bt) in serum (left panel) or urine (right panel). Violin plot: median and quartiles. Mean ± s.e.m. of one experiment with n = 4 (Cs, serum), n = 3 (Cs, urine), n = 5 (Bt, serum), n = 4 (Bt, urine), n = 7 (six-member, serum), n = 6 (six-member, urine), and n =9 germ-free mice pooled from both mono-association (n = 4) and community (n = 5) experiments. c, Serum metabolite levels in mice colonized with the six-member community (+Cs) or the five-member community (−Cs). Metabolites shown represent a panel of significantly elevated or reduced metabolites (≥ 4-fold, corrected P < 0.05) in the six-member community. Mean ± s.e.m. of one experiment with n = 7 (six-member community) and n = 8 (five-member community) mice. Venn diagram: significantly elevated or reduced metabolites in different host biofluids based on the same threshold defined above. a-c, P values: two-tailed t-test with Benjamini-Hochberg correction for multiple comparisons. * P < 0.05, ** P < 0.01, *** P < 0.001.
