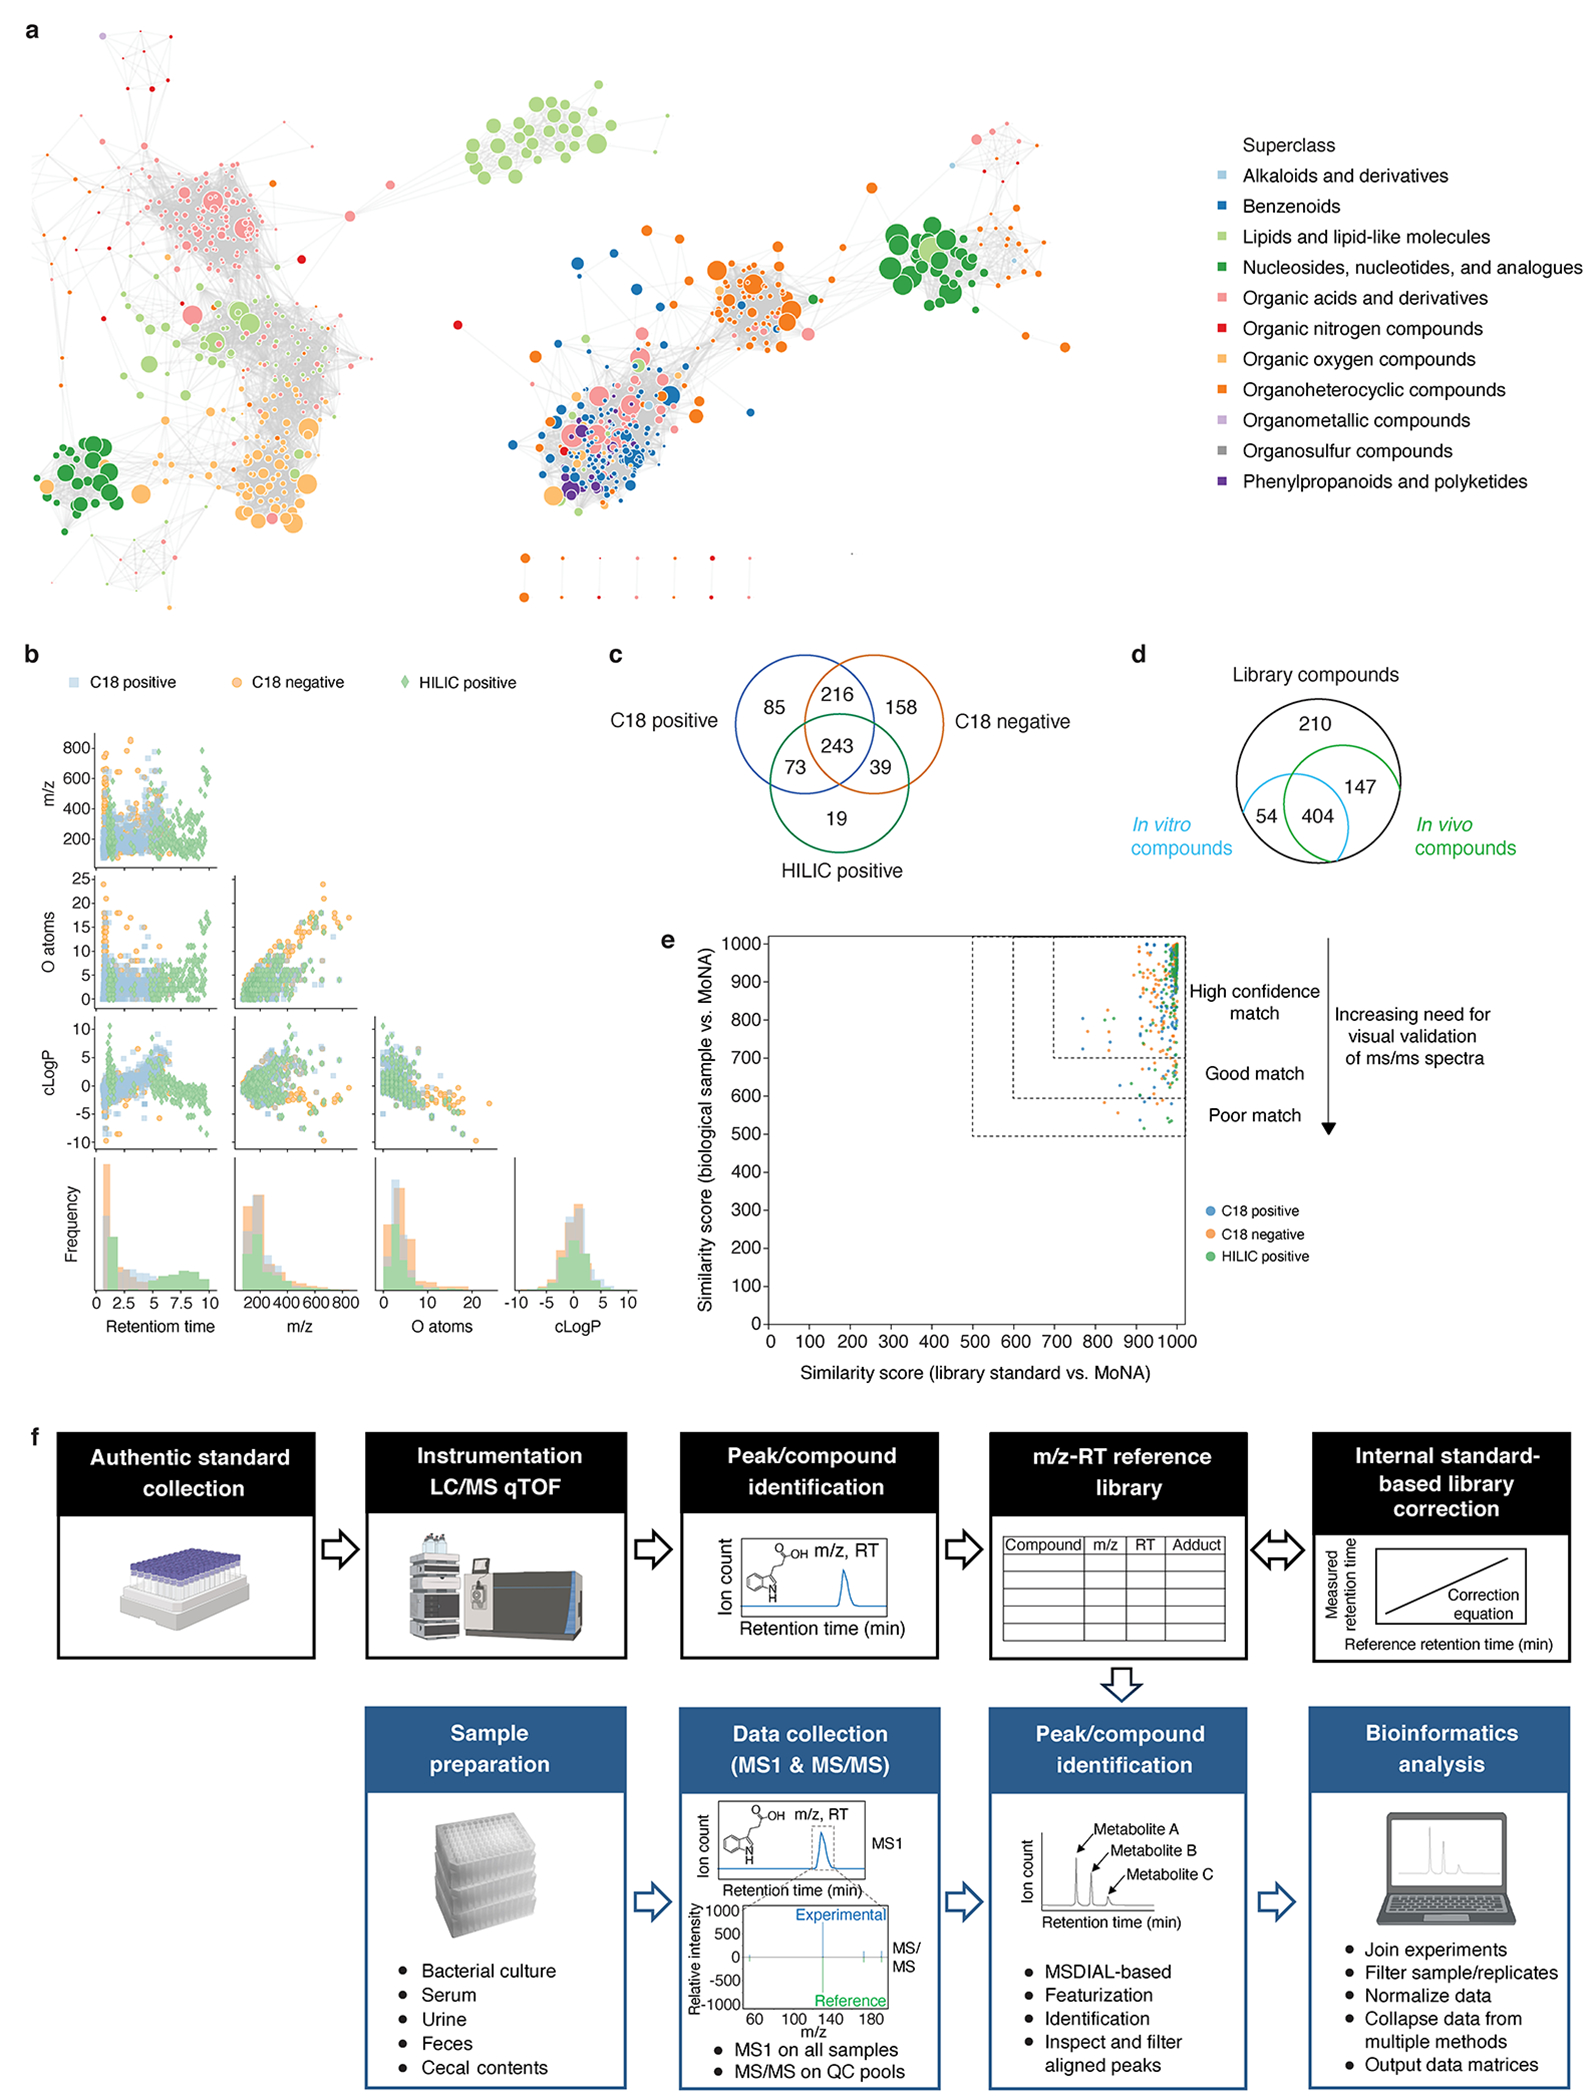
Extended Data Fig. 1, Summary statistics on mass spectrometry reference library metabolites, their detection, and validation.

a, Chemical similarity network of the compound library. Network nodes: library compounds colored by their superclasses. Node size: monoisotopic mass. Edges between nodes: substructure similarity values above a z-score threshold of 1 standard deviation from the mean. b, Scatter plots and histograms of chemical properties of 833 library metabolites. c, Venn diagram of library compounds that are detected by each of the three methods. d, Venn diagram of compounds (by PubChem CID) identified in the reference compound library (Supplementary Table 1), in vitro conditions (Supplementary Table 7, “count.ps”), and in vivo conditions (Supplementary Table 8, “istd_corr_ion_count_matrix”). In vitro conditions include all media types, and in vivo conditions include all sample types: urine, serum, feces, and cecal contents, and all colonization states. e, Scatterplot of all pairwise similarity scores (biological sample vs. library) of the same compound searched against the MoNA spectra database. All library standards (median similarity score = 992) and 97.3% of corresponding compounds from biological samples (median similarity score = 923) exhibit similarity scores ≥ 600, and 2.7% of those compounds from biological samples score below 600. Confidence levels are determined based on both similarity scores and visual validation of the MS/MS spectra. f, Schematic of the metabolomics pipeline’s data collection and analysis workflow. Created with Biorender.com
