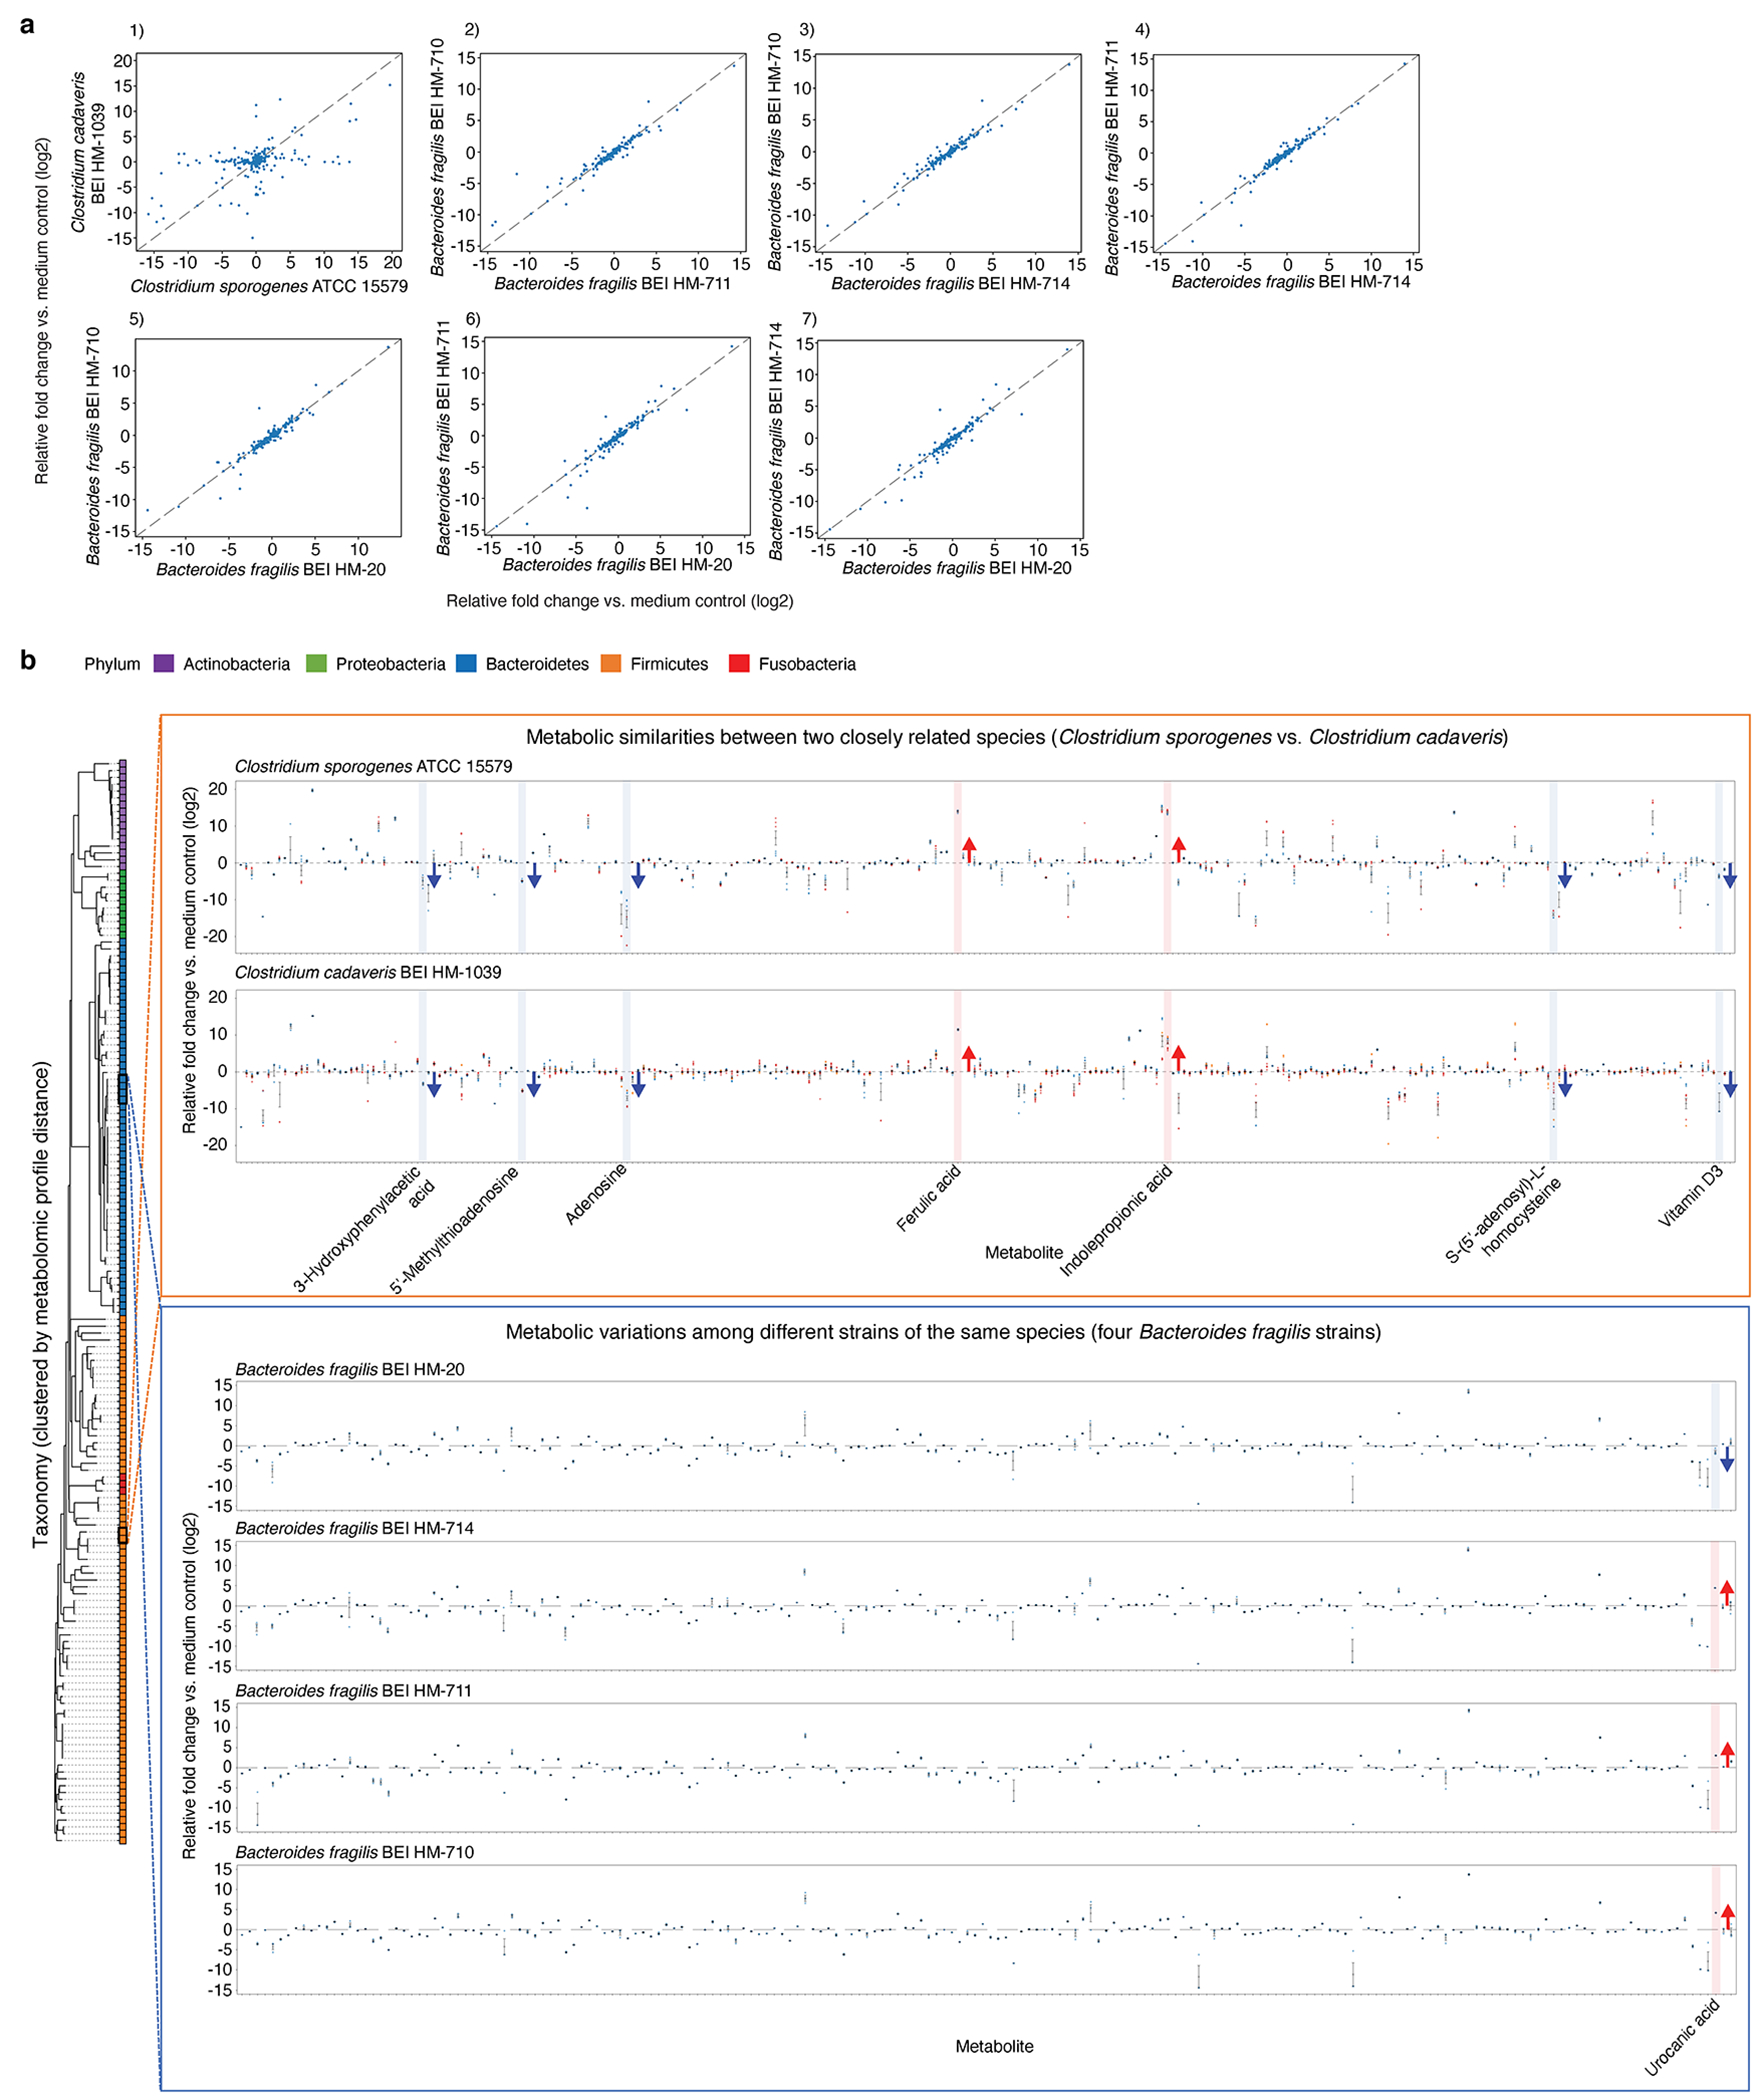
Extended Data Fig. 5, Metabolic profile variation among related bacteria.

a, Pairwise metabolomic profile comparisons between two closely related strains grown in mega medium: Clostridium sporogenes ATCC 15579 and Clostridium cadaveris HM-1039 (subpanel 1), and among four strains of Bacteroides fragilis (subpanels 2-7): HM-710, HM-711, HM-714, and HM-20. Each dot represents an averaged fold-change value (log2-transformed) from one to three independent experiments, each with n = 3 biological replicates. Pearson correlation r values of pairwise metabolomic profile comparisons, performed on standardized and scaled data: ATCC 15579 vs. HM-1039 (r = 0.063), HM-711 vs HM-710 (r = 0.859), HM-714 vs. HM-710 (r = 0.866), HM-714 vs. HM-711 (r = 0.880), HM-20 vs. HM-710 (r = 0.829), HM-20 vs. HM-711 (r = 0.845), and HM-20 vs. HM-714 (r = 0.807). b, Metabolic similarities and variations among closely related species of C. sporogenes and C. cadaveris, and among different strains of the same species of B. fragilis grown in mega medium. Taxonomies shown are clustered by 16S phylogenetic distance, and are colored by distinct phyla. Mean ± s.e.m. from one to three independent experiments, each with n = 3 biological replicates
