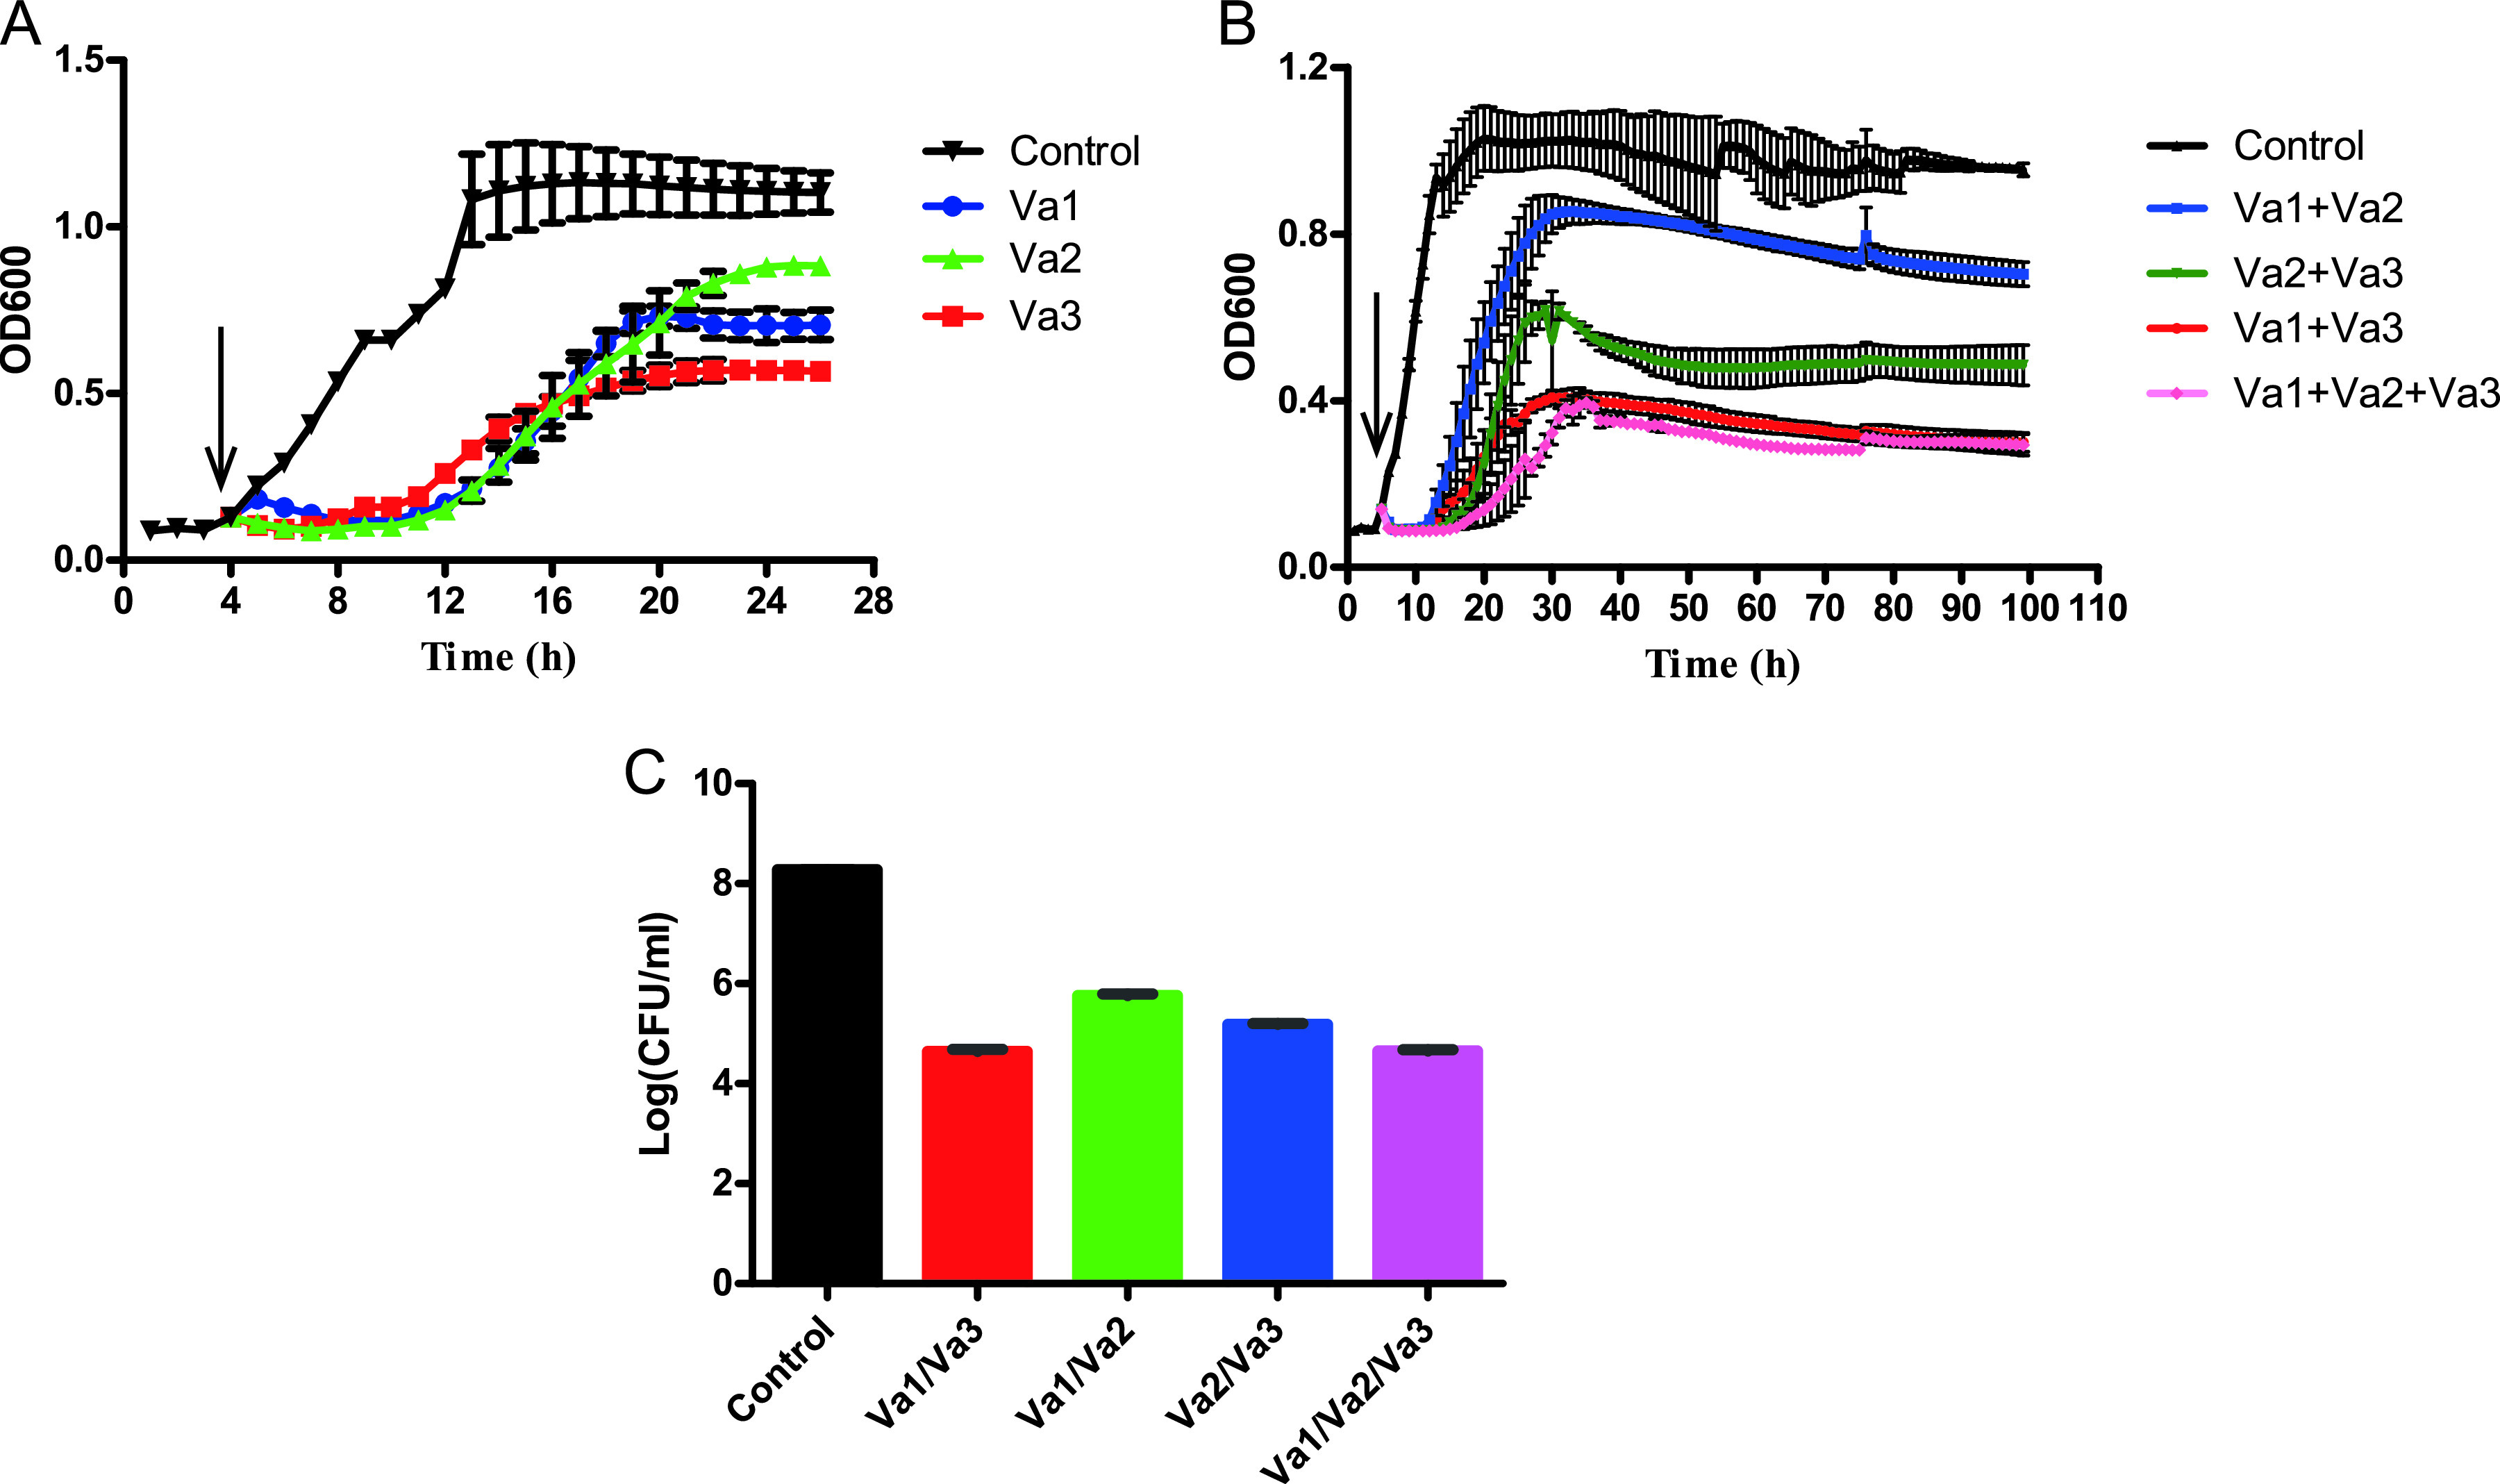
FIG 4.

(A and B) Growth curves of V. alginolyticus 283T infected by Va1, Va2, and Va3 alone (A) and combinations of these three phages at an MOI of 1 (B). (C) The number of V. alginolyticus 283T phages in each group after treatment for 96 h. The arrows indicate the time point when the phages were added in the bacterial medium. The data are shown as mean ± SD, and the P values (calculated by one-way ANOVA and Student's t test) are shown in Tables S5 to S7 in the supplemental material.
