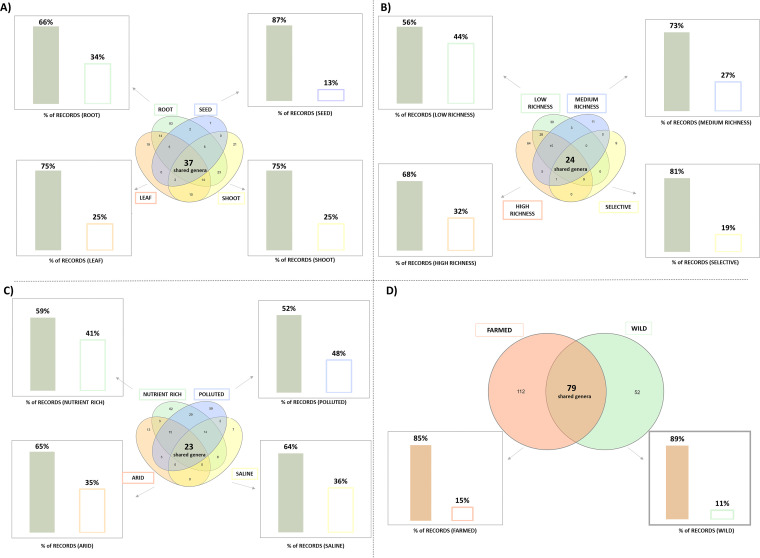
FIG 1.
Number of shared bacterial genera and the correspondent record percentage for each comparison. Venn diagrams represent the bacterial genera shared between the categories when comparing (A) plant compartments, (B) isolation media, (C) soil types, and (D) growing conditions. Bar charts indicate, for each comparison, the percentage of records referred to the bacterial genera shared among all the categories (filled bars) or isolated only from some categories (empty bars). Venn diagrams were generated using the open software InteractiVenn at http://www.interactivenn.net/.

