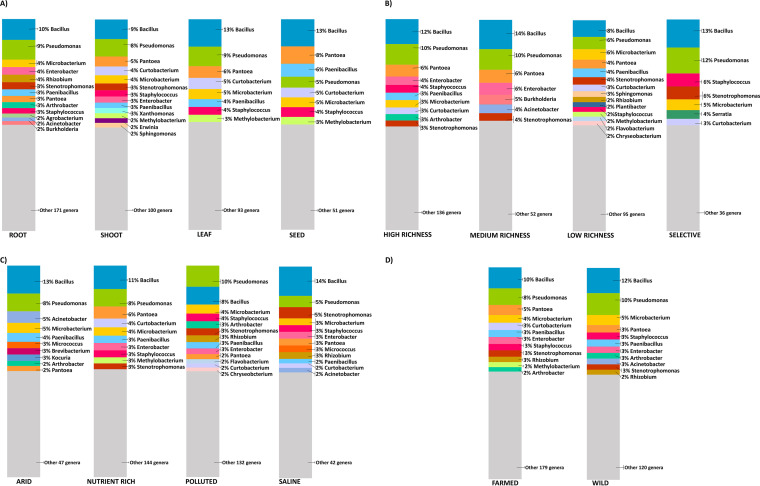
FIG 2.
Representation of the genera most represented in the data set. Comparison of the endophytic bacteria isolated (A) from different plant compartments, (B) with different isolation media, (C) from plants grown in different soil types, and (D) from wild and farmed plants. In each panel, the graph shows the phylogenetic affiliation of the most represented bacterial genera up to 50% of records for each category. Each genus is represented with the same color in the different graphs. The gray portion of the bars is the 50% of records that includes the less represented bacterial genera in the categories.

