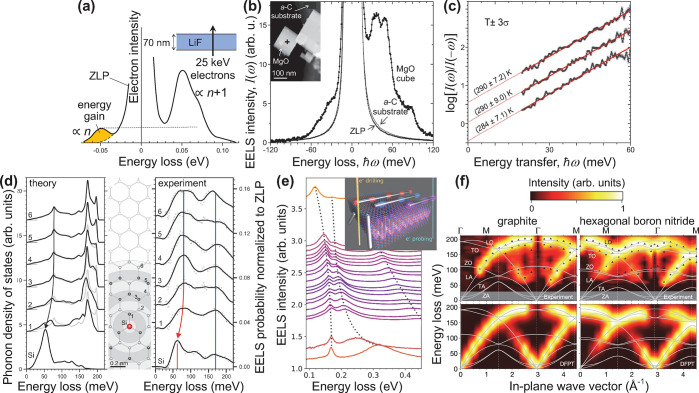
Figure 2.
Electron-beam vibrational spectromicroscopy. (a) Spectral features of phonon polaritons in LiF recorded through energy losses and gains experienced by 25 keV electrons transmitted through a thin foil, with the gains originating in thermally populated modes at room temperature T ≈ 300 K and the loss-to-gain peak ratio approximately given by 1 + 1/nT(ω) = eℏω/kBT (∼7 at ℏω = 50 meV). Adapted with permission from ref (20). Copyright 1966 American Physical Society. (b, c) Nanoscale e-beam thermometry based on high-resolution EELS of a MgO cube (b), whereby the sample temperature is determined upon examination of the loss-to-gain intensity ratio (c). Adapted with permission from ref (21). Copyright 2018 American Chemical Society. (d) Atomic resolution in the mapping of vibrational spectra, here used to image the localization of the phonon density of states produced by a Si defect in monolayer graphene. Adapted with permission from ref (22). Copyright 2020 American Association for the Advancement of Science. (e) Strong coupling between hBN photon polaritons and silver nanowire plasmons observed through high-resolution EELS by iterative e-beam drilling to shrink the wire length and scan one of its plasmon resonances over the phononic spectral region. Adapted with permission from ref (23). Copyright 2020 American Chemical Society. (f) Phonon dispersion in graphite and hBN obtained by high-resolution angle-resolved EELS. Adapted with permission from ref (24). Copyright 2019 Springer-Nature.

