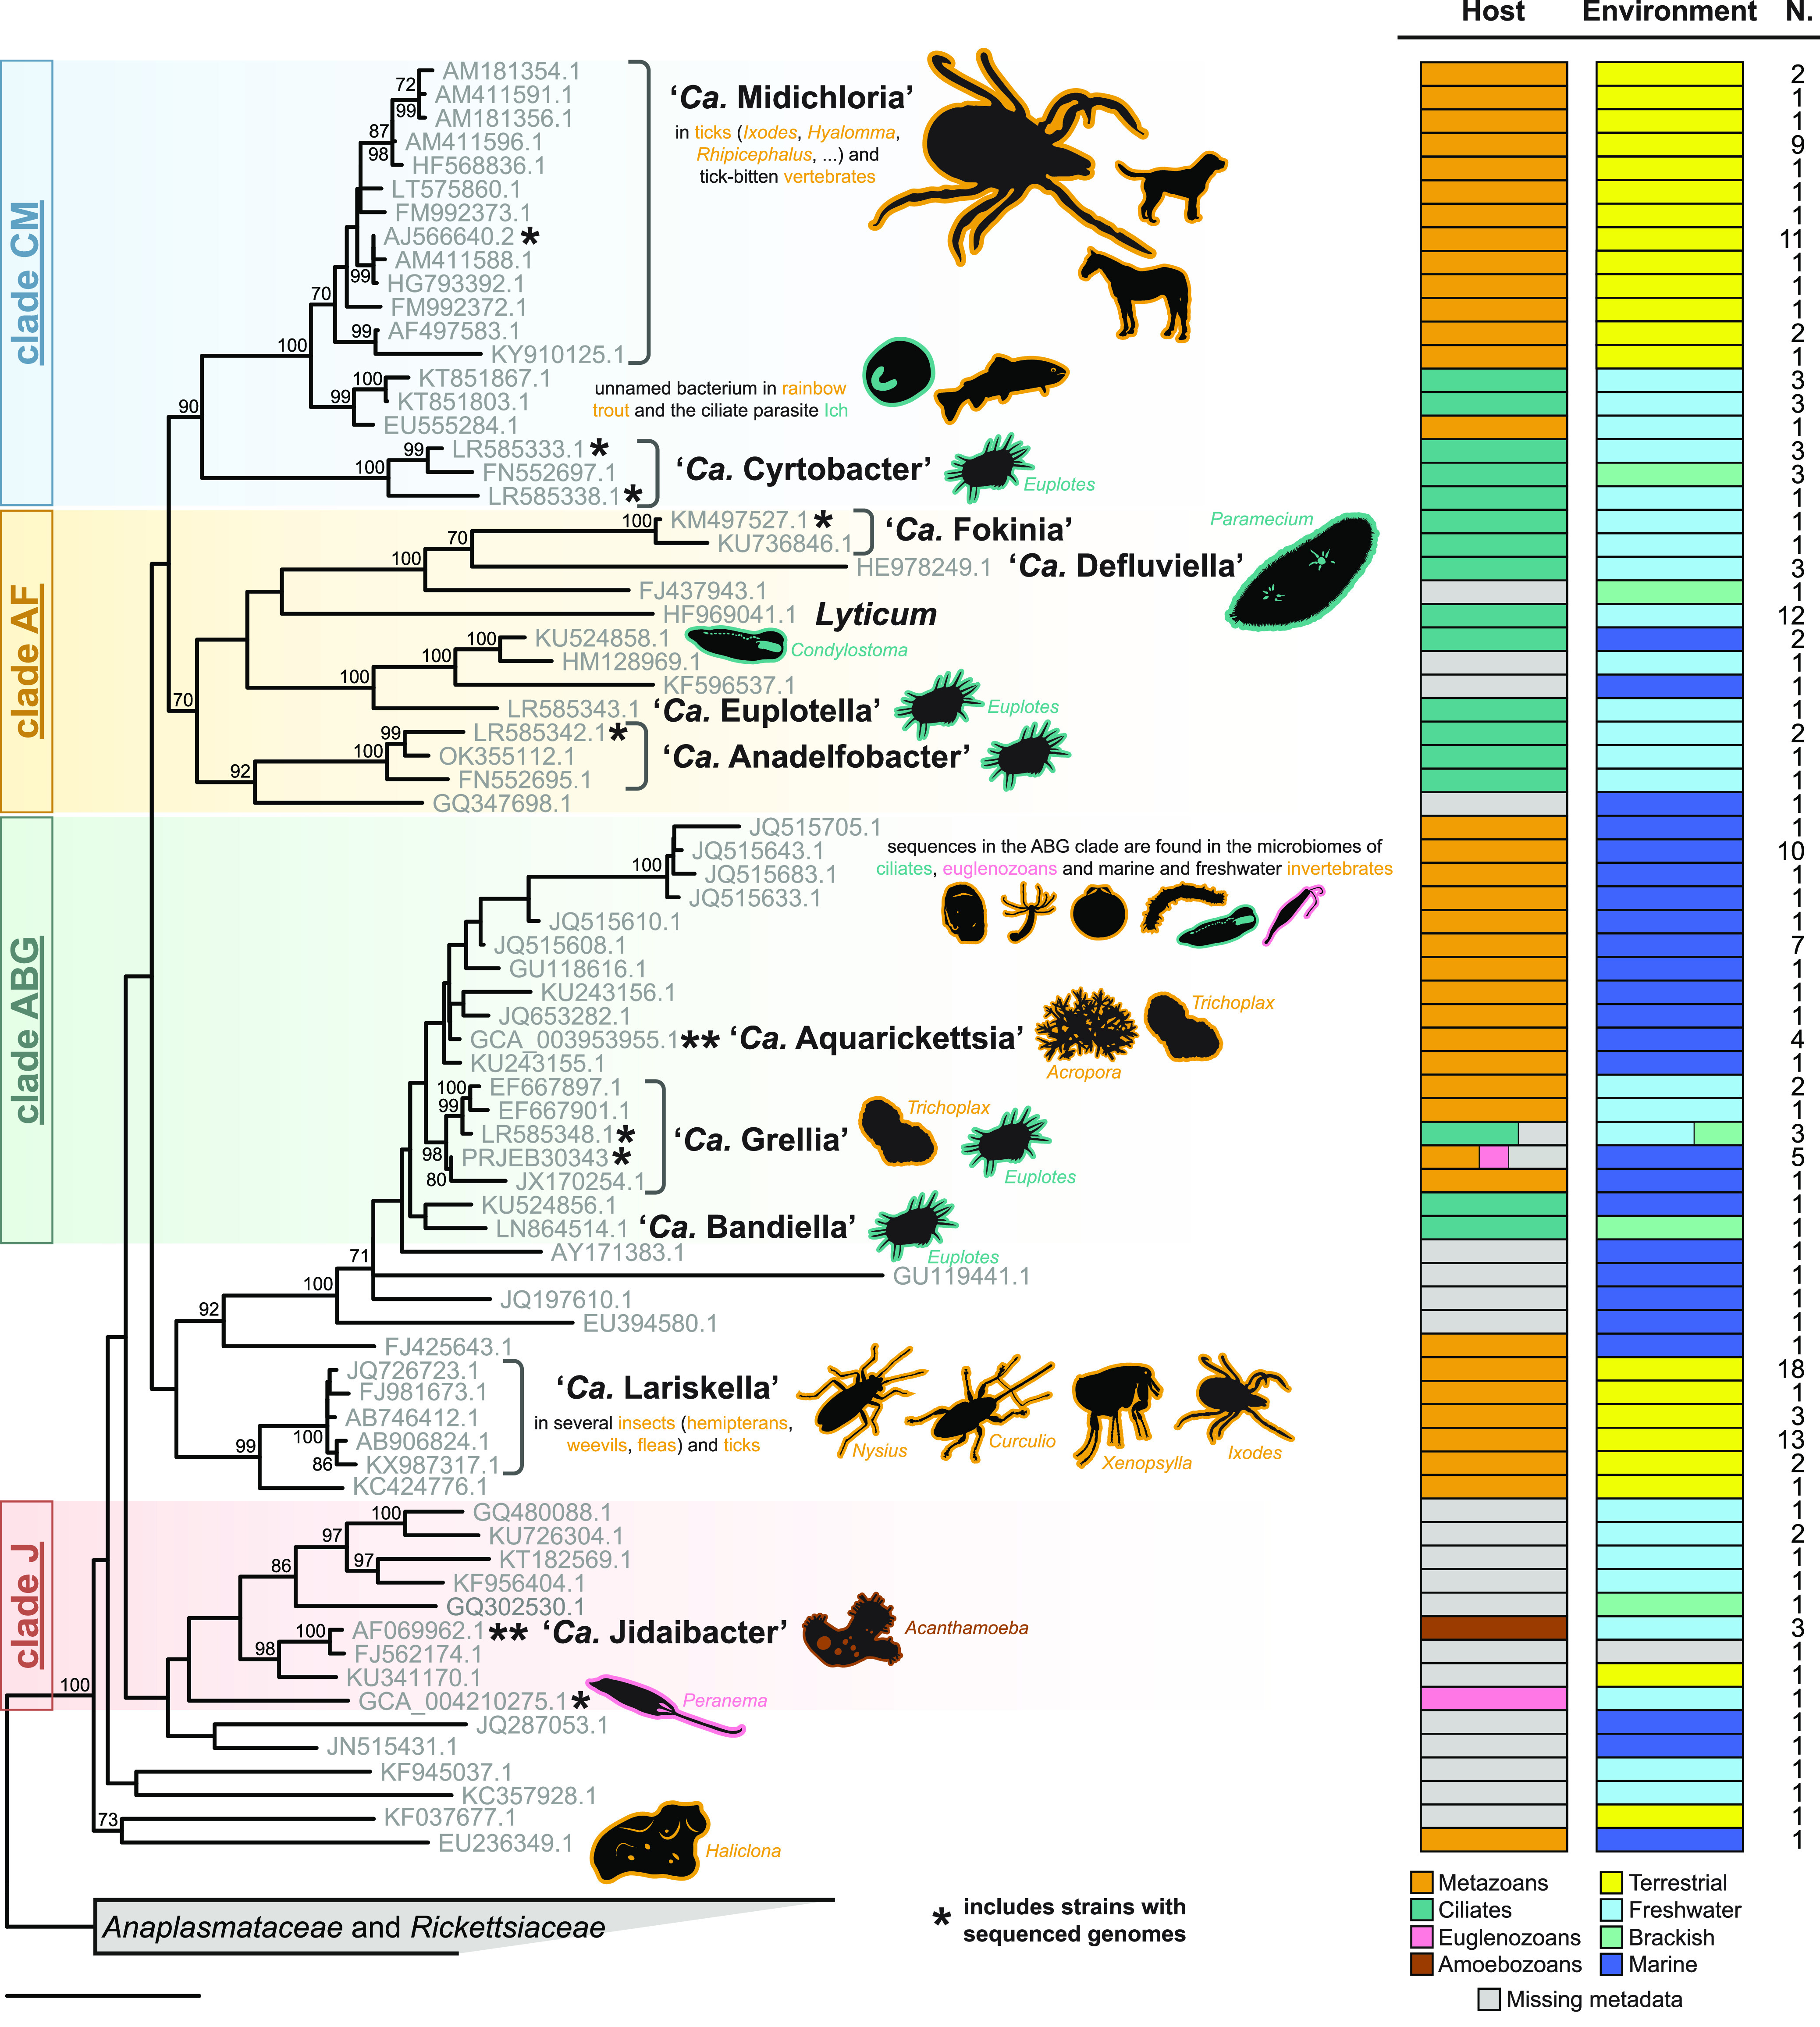
FIG 3.

16S rRNA gene phylogeny and ecological traits of “Ca. Midichloriaceae.” Maximum-likelihood single-gene inference obtained after constraining the four main clades recovered by the phylogenomic analysis (labeled on the left). Each sequence in the tree represents a cluster of ≥99% similar sequences, whose numbers are shown in the rightmost column (N.). Host and environment bar plots depict trait frequencies in each cluster. Named and otherwise relevant bacterial taxa are highlighted, and the main hosts are shown as silhouettes with lines colored corresponding to their taxonomy (metazoans, ciliates, amoebozoans, and euglenozoans). Note that for most marine invertebrate hosts, the presence of “Ca. Midichloriaceae” was detected only by high-throughput sequencing, without histological confirmation that the bacterium infects animal tissues (instead of, for example, protist symbionts in the animal). Asterisks mark clusters that include one or more strains with a sequenced genome (Fig. 1 and 2). Bootstrap values below 70% are not shown. The bar corresponds to an estimated sequence divergence of 0.1.
