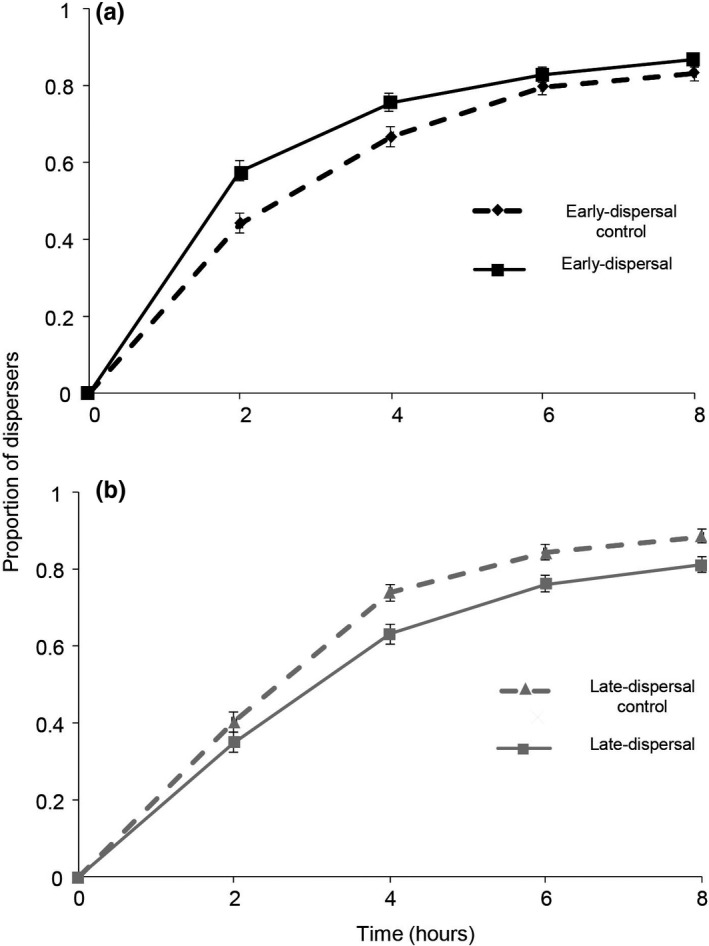
FIGURE 2.

Predatory mites respond to artificial selection on the timing of dispersal. Panels show average proportions of dispersers (±SE) through time. (a) The early‐dispersal selection line and its control line. (b) The late‐dispersal selection line and its control line. Black dashed line with rhombus: early‐dispersal‐control line, black solid line with a square: early‐dispersal line, gray dashed line with triangle: late‐dispersal‐control line, gray solid line with a circle: late‐dispersal line. N = 12 for each line
