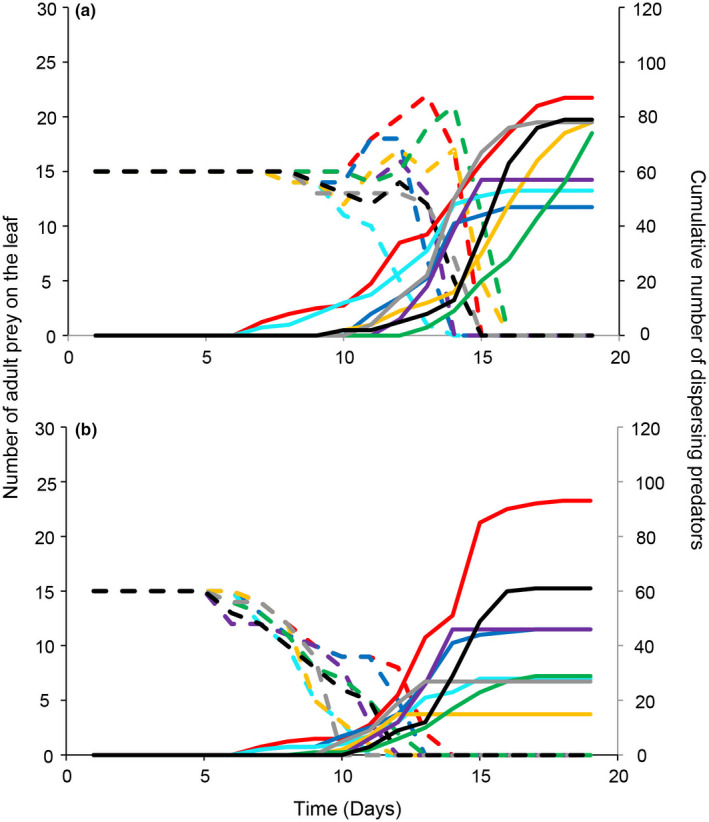
FIGURE 3.

Population dynamics of adult prey on the experimental leaf (dashed lines, left‐hand vertical axis) and a cumulative number of dispersing predators (solid lines, right‐hand vertical axis). (a) Early‐dispersal selection line; (b) Late‐dispersal selection line. Different colors correspond to different replicates. N = 8 for each line
