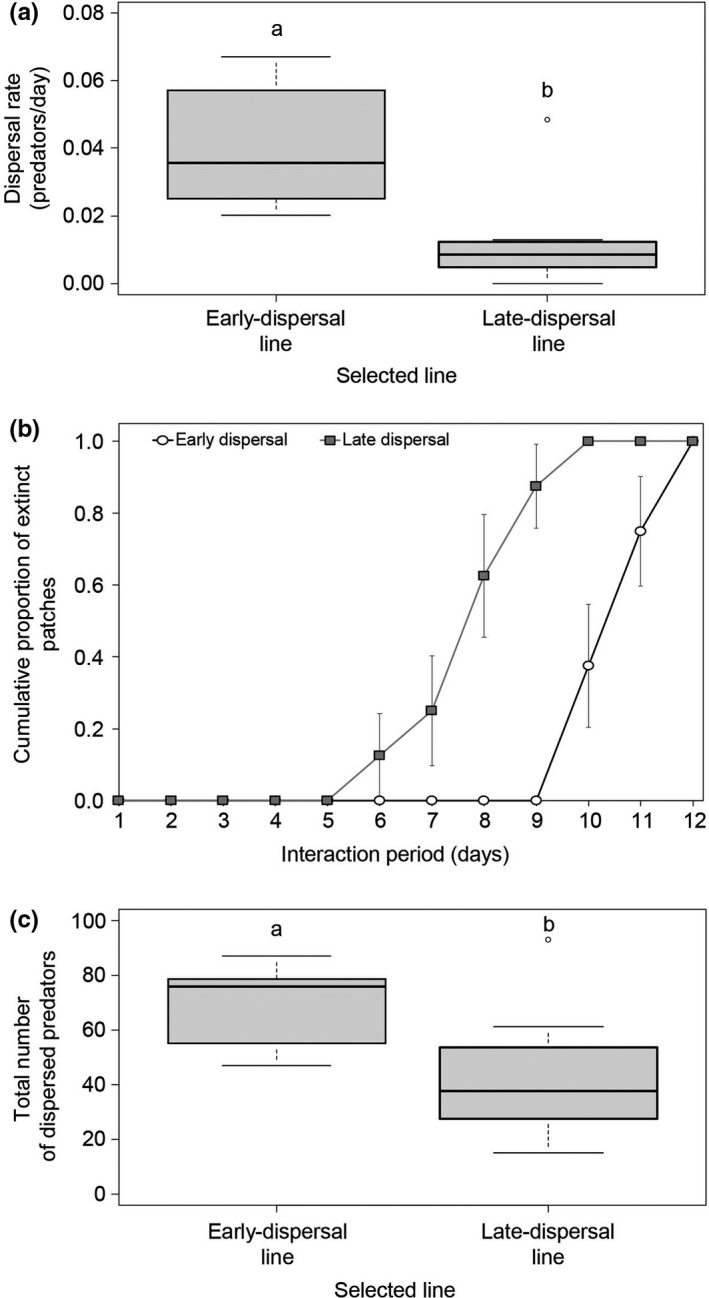
FIGURE 4.

Parameters from the two selected lines in a population dynamics experiment. (a) the dispersal rate during prey exploitation (i.e., the time interval between predator introduction and the last day with at least three adult prey individuals on the leaf), (b) the cumulative proportion of patches that went extinct during the interaction period (i.e., the time interval between predator introduction to the leaf and prey elimination), and (c) the total number of dispersers throughout the experiment. Boxes indicate the second and the third quartile; horizontal lines indicate the medians, whiskers above and below the box indicate the 90th and 10th percentiles. Different letters indicate significant differences (N = 8 for each line). Early‐dispersal line: black line with white circles; late‐dispersal line: gray line with gray squares
