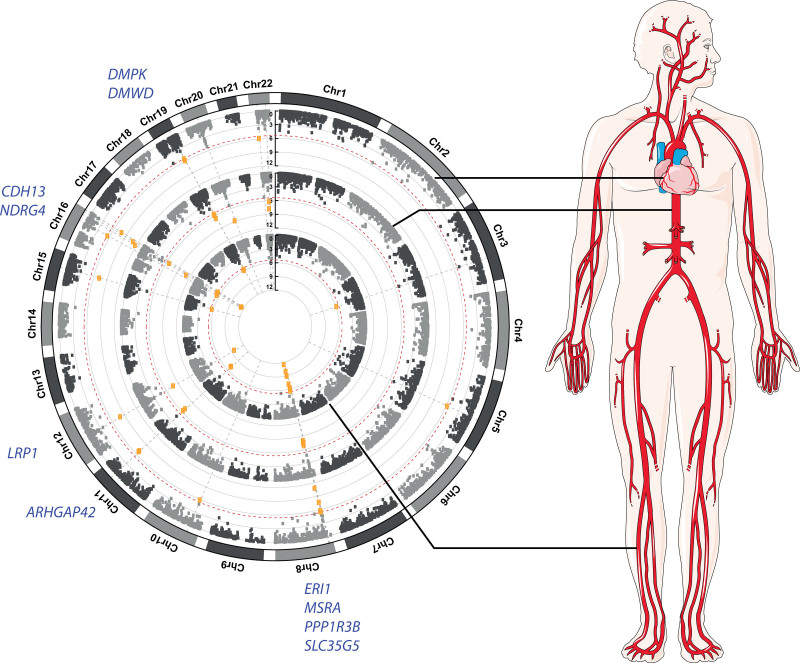
Figure 3.
Circular Manhattan plots of transcriptome-wide association study (TWAS) results in arterial tissues for average of mean carotid intima-media thickness. Single-tissue TWAS was performed using Genotype-Tissue Expression data on aorta, coronary artery, and tibial artery tissue. Red dotted line: Bonferroni-corrected significance thresholds. Highlighted are the genes that were significant in all arterial tissues. Part of the figure was modified from materials provided by Servier Medical art, licensed under a Creative Common Attribution 3.0 Generic License. Chr indicates chromosome.

