Figure 5.
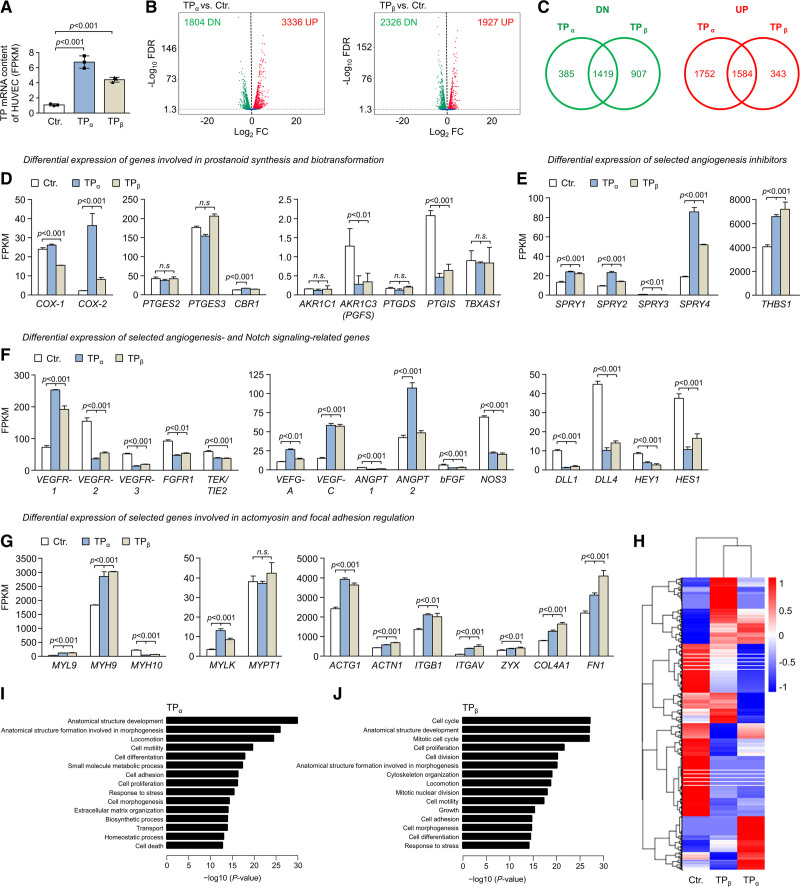
TP (thromboxane A2 receptor) overexpression induces profound changes in the human umbilical vein endothelial cell (HUVEC) transcriptome. A, Expression levels of TPα or TPβ mRNA in lentiviral transduced HUVECs was analyzed by RNA-seq (n=3). B, Volcano plots showing differential gene expression in TPα- and TPβ-overexpressing HUVECs, respectively, as determined by RNA-seq. C, The overlap of mRNAs significantly upregulated (UP; red) or downregulated (DN; green) in TPα- and TPβ-overexpressing HUVECs is depicted by Venn diagrams. The numbers shown in the diagrams indicate the number of transcripts with significantly deregulated expression upon overexpression of TPα or TPβ in HUVECs. Fragments per kilobase of transcript per million mapped reads (FPKM) of each gene was calculated based on gene length and read counts mapped to the respective gene. Differential gene expression analysis was performed using the DESeq2 software package (v1.20.0). Resulting P values were adjusted using the Benjamini and Hochberg approach to control the false discovery rate (FDR). The expression level of selected mRNAs involved in cellular prostanoid formation and biotransformation (D), inhibition of angiogenesis (E), regulation of angiogenesis and Notch signaling (F), or actomyosin and focal adhesion regulation (G) were determined by RNA-seq in control-transduced HUVECs (Ctr.), as well as in HUVECs transduced to overexpress the TPα or TPβ isoform and are shown as FPKM. Data are displayed as mean+SD (n=3). Statistical analyses in D–G were performed using 1-way ANOVA followed by the Sidak multiple comparisons test. H, Hierarchical clustering of differentially expressed genes using FPKM as the input. Transcript expression profiles derived from HUVECs transduced to overexpress either TPα or TPβ, respectively and from control-transduced HUVECs (Ctr.) are shown. The heat map color range from red to blue represents the log10(FPKM+1) value in which red denotes genes with high expression levels and blue denotes genes with low expression levels. I and J, Top gene ontology (GO) biological process terms significantly enriched in differentially expressed genes of TPα-overexpressing or TPβ-overexpressing HUVECs. GO pathway enrichment analyzes were performed using the GOseq R software package (v1.34.1). GO terms with an adjusted P<0.05 were considered significantly enriched.

