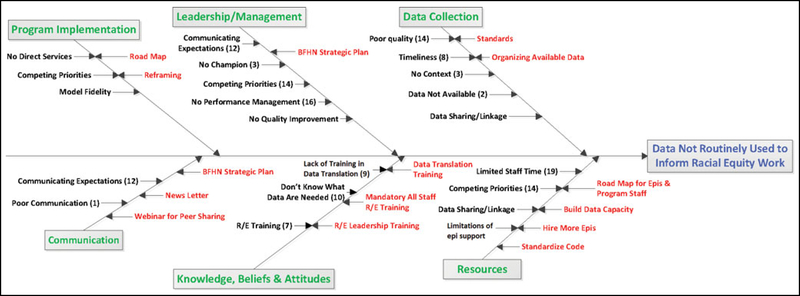
FIGURE 4.
Cause and Effect Diagram With the Addition of Cards (CEDAC): Mapping the Challenges and Potential Solutions Identified in Key Informant Interviews and Program Director Survey, Massachusetts Department of Public Health, 2018a,b
Abbreviations: BFHN, Bureau of Family Health and Nutrition; Epi, epidemiologist; R/E, racial equity.
aIf mentioned by more than 1 respondent, the number of times a challenge was mentioned is listed in parentheses. Challenges are listed on the left side of the line for each category and potential solutions are listed on the right side of the line.
bData were obtained through key informant interviews (4 individuals and 5 groups) and a survey of 30 program directors (response rate 97%).

