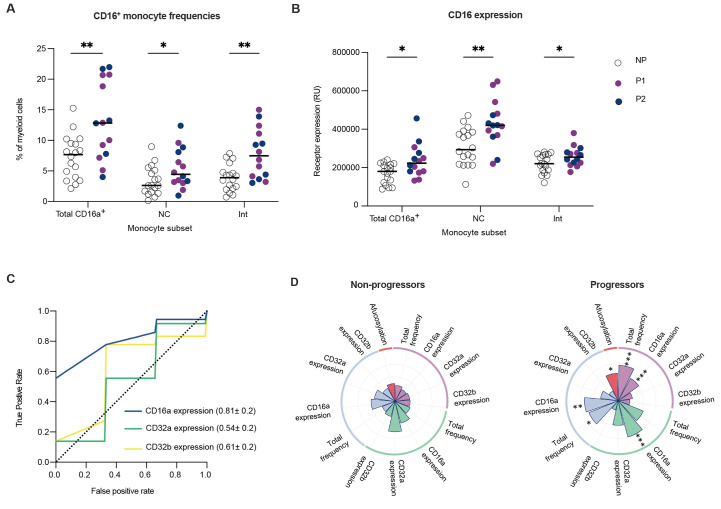
Fig. 2.
CD16a signaling potential is elevated in the myeloid compartment of progressors. Enrollment time point PBMCs were characterized in progressors (n=14) and a randomly selected subset of non-progressors (n=18). Solid purple and blue circles represent data points from progressors within Cohort 1 and Cohort 2, respectively whereas open circles represent data points from non-progressors. The median values have been depicted with a black line. (A) Total CD16a+ monocyte, CD16a+ CD14- non-classical monocyte (NC), and CD16a+ CD14+ intermediate monocyte (Int) frequencies are shown as percentages of total CD11c+ HLA-DR+ CD3- CD19- CD56- myeloid cells. (B) CD16a expression was measured on total CD16a+, non-classical, and intermediate monocyte populations. Receptor expression is measured in relative units (RU) (C) Mean ROC response and the AUC with its standard deviation were obtained using random forest classifier with 6-fold cross validation in two outpatient cohorts using FcγR expression on myeloid cells. (D) Radar plots summarizing the various features of IgG1-CD16a signaling axis in progressors and non-progressors are shown. Significant differences between the two groups are indicated with asterisks in the radar plot for progressors. P values in (A and B) were calculated using unpaired t tests with Welch’s correction. *P < 0.05, **P < 0.01, ***P < 0.001.

