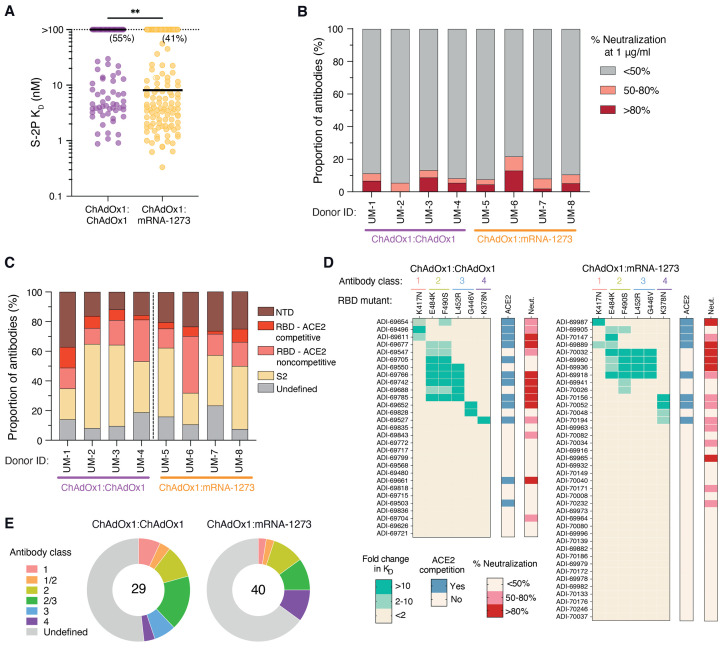
Fig. 3. Binding and neutralization properties of monoclonal antibodies isolated from ChAdOx1 and mRNA-1273 boosted donors.
(A) Fab binding affinities for S-2P, as determined by BLI. Antibodies with no detectable monovalent binding activity are excluded and those with weak binding affinities that could not be fit to a 1:1 binding model are plotted as KD >100 nM. Black bars indicate medians. Values in parentheses indicate the percentage of antibodies with KD >100 nM. (B) Proportion of antibodies exhibiting <50%, 50-80%, and >80% neutralization activity against MLV-SARS-CoV-2 Wuhan-1 at a concentration of 1 μg/ml. (C) Proportion of S-2P-reactive antibodies directed to each of the indicated subdomains within prefusion S. Competitive hACE2 binding was determined using a BLI-based competition assay. (D) Heatmaps displaying fold change in binding affinity of anti-RBD antibodies to variant RBDs containing the indicated single point mutations. Competitive hACE2 binding activity and percentage neutralization against MLV-SARS-CoV-2 Wuhan-1 at a concentration of 1 μg/ml are shown in the bars on the right. (E) Summary of the distribution of anti-RBD antibodies belonging to each of the indicated classes. The numbers in the center of the pies indicate the total number of antibodies analyzed. Statistical comparisons were made by (A) two-sided Mann-Whitney U tests. KD, equilibrium dissociation constant. **P < 0.01.

