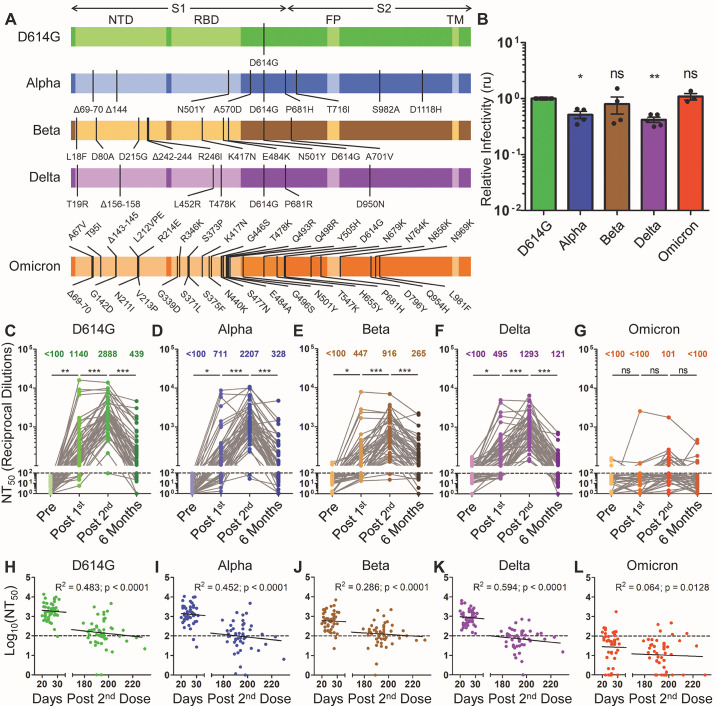
Fig. 1. The durability of vaccine-induced immunity wanes over time.
Gaussia luciferase reporter gene-containing pseudotyped lentiviruses were produced bearing the spike protein from SARS-CoV-2 variants. (A) Schematic representations of the SARS-CoV-2 variant spike proteins tested are shown, including D614G, Alpha (B.1.1.7), Beta (B.1.351), Delta (B.1.617.2), and Omicron (B.1.1.529). The schematics highlight the location of the S1 and S2 subunits of the spike protein as well as the N-terminal domain (NTD), receptor-binding domain (RBD), fusion peptide (FP), transmembrane region (TM), and the indicated mutations. (B) Pseudotyped lentiviruses were used to infect HEK293T-ACE2 cells. Media was harvested from infected cells 48 hours after infection and assayed for Gaussia luciferase activity to determine the relative infectivity of each variant pseudotyped virus; infectivity was measured as luminescence signal relative to D614G signal, relative units (ru). Significance relative to D614G was determined by one-way ANOVA with Bonferroni’s correction (n ≥ 3 biological replicates); error bars represent means ± standard error. (C to G) Lentivirus pseudotyped with SARS-CoV-2 spike protein from D614G (C), Alpha (D), Beta (E), Delta (F), and Omicron (G) were neutralized with serum samples from health care workers (HCWs) (n = 48 biological replicates) collected pre-vaccination (Pre), post-vaccination with a first mRNA vaccine dose (Post 1st), post-vaccination with a second mRNA vaccine dose (Post 2nd), and six months post second dose (Six Months). Neutralization titers 50% (NT50) values were determined by least-squares fit non-linear regression. Mean NT50 values are shown at the top of the plots, and NT50 values below 100 were considered background, as indicated by a dashed line; significance was determined by one-way repeated measures ANOVA with Bonferroni’s correction. (H to L) Log10-transformed NT50 values against D614G (H), Alpha (I), Beta (J), Delta (K), and Omicron (L) variants were plotted against days post-second vaccine dose of sample collection (n = 96 biological replicates). The goodness of fit (R2) and p-values are displayed on each plot as determined by least-squares fit linear regression. The dotted lines correspond to the background (NT50 < 100). In all cases, *p < 0.05; **p < 0.01; ***p < 0.001; ns: not significant.

