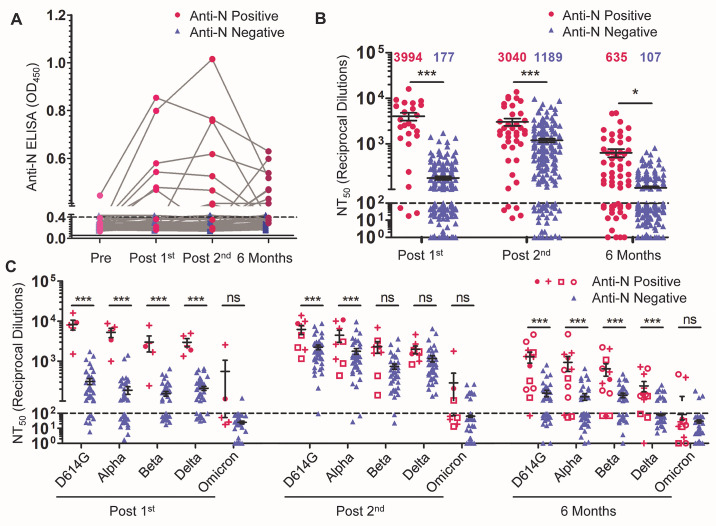
Fig. 2. The durability of the nAb response is influenced by prior COVID-19 infection and mRNA vaccine type.
COVID-19 status was determined by anti-N protein ELISA. Individuals were characterized as anti-N protein positive (optical density [OD]450 > 0.4 at any time point; n = 12) or anti-N protein negative (OD450 < 0.4 for all time points; n = 36). (A) ELISA optical density at 450nm (OD450) are shown for anti-N protein positive and anti-N protein negative HCWs. The dashed line indicates the cut-off of 0.4. (B) Comparisons of NT50 values between anti-N protein positive and anti-N protein negative HCWs are shown for the indicated time points. NT50 values against all variants were combined and plotted at post-first vaccine dose (n = 25 anti-N protein positive; n = 215 anti-N protein negative), post-second vaccine dose (n = 40 anti-N protein positive; n = 200 anti-N protein negative), and six months post-second vaccine dose (n = 60 anti-N protein positive; n = 180 anti-N protein negative). Significant differences were determined by two-way ANOVA with Bonferroni’s correction. (C) Comparisons of NT50 values against different variants between anti-N protein positive and anti-N protein negative HCWs are shown for the indicated time points. For anti-N protein positive HCWs, timing of first anti-N protein positive sample is distinguished as: pre-vaccination (solid magenta circle ●, n = 1); post-first dose (magenta cross +, n = 4); post-second dose (magenta open square □, n = 3); and six months-post second (magenta open circle ○, n =4). These are plotted alongside anti-N protein negative HCWs (all shown in green blue ▲) for three time points: post-first vaccine dose (n = 5 anti-N protein positive; n = 43 anti-N protein negative), post-second vaccine dose (n = 8 anti-N protein positive; n = 40 anti-N protein negative), and six months post-second vaccine dose (n = 12 anti-N protein positive; n = 36 anti-N protein negative). Significant differences were determined by two-way repeated-measures ANOVA with Bonferroni’s correction. For panels B and C, error bars indicate means ± standard errors, and the dashed horizontal line indicates the limit of detection (NT50 < 100). In all cases, *p < 0.05; **p < 0.01; ***p < 0.001; ns: not significant.

