Fig. 2.
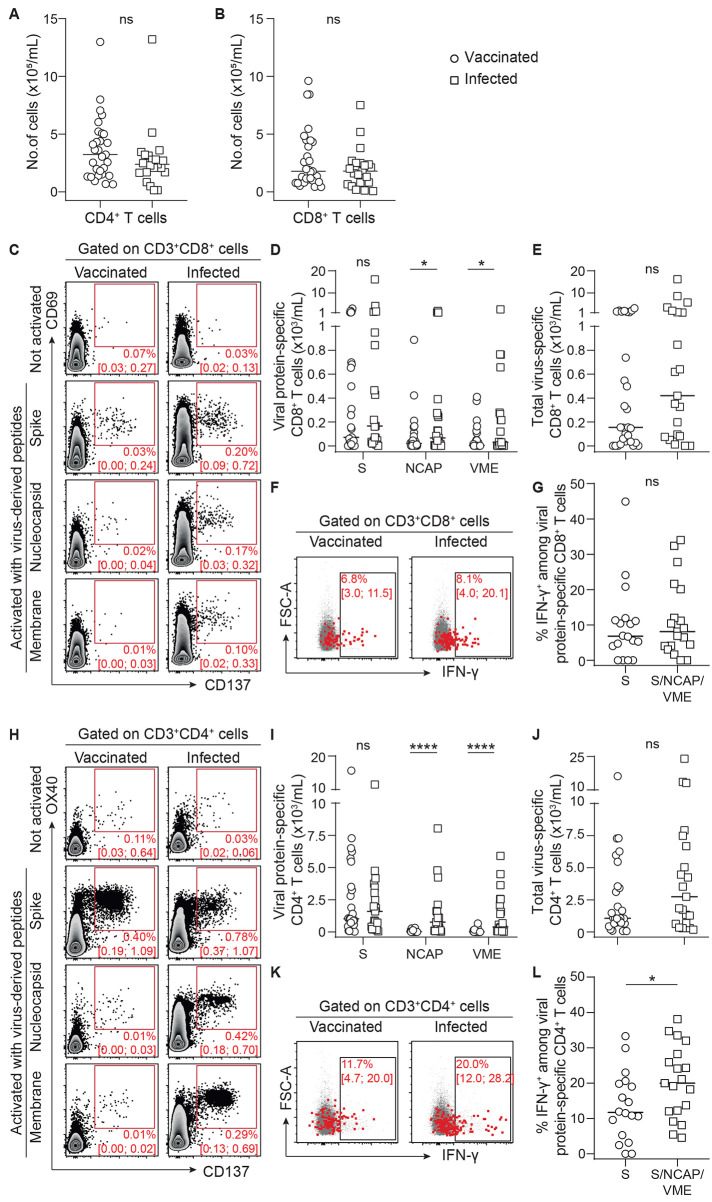
SARS-CoV-2-specific cellular immunity was comparable in previously infected and vaccinated transplant recipients. (A and B) CD4+ (A) and CD8+ (B) T cells were enumerated in the circulation of recently infected (n=21; open squares) and vaccinated (n=29; open circles) transplant recipients. (C to L) CD8+ T cells (C to G) and CD4+ Th1 cells (H to L) directed against the spike (S), nucleocapsid (NCAP), and membrane (VME) proteins of SARS-CoV-2 were enumerated in the circulation of recently infected and vaccinated transplant recipients. Data were background subtracted against DMSO negative control. (C) Flow cytometry profiles of a representative patient of each group are shown. Median percentage and interquartile range are indicated. (D) The count of CD8+ T cells specific to each viral protein is plotted for each patient. (E) For each patient, the total number of virus-specific CD8+ cytotoxic T cells is plotted. (F) Concatenated flow cytometry profiles of the two groups of patients are shown. Median percentage and interquartile range are indicated. FSC-A, forward scatter area. (G) The proportion of INFγ-producing SARS-CoV-2-specific CD8+ cytotoxic T cells is plotted for each patient (infected patients, n=7; vaccinated patients, n=18). (H) Flow cytometry profiles of a representative patient of each group are shown. Median percentage and interquartile range are indicated. (I) The count of Th1-polarized CD4+ T cells specific to each viral protein is plotted for each patient. (J) For each patient, the total number of virus-specific Th1-polarized CD4+ T cells is plotted. (K) Concatenated flow cytometry profiles of the two groups of patients are shown. Median percentage and interquartile range are indicated. (L) The proportion of IFN-γ-producing SARS-CoV-2-specific Th1 CD4+ T cells is plotted for each patient (infected patients, n=7; vaccinated patients, n=18). The bars indicate the median. Data were analyzed using a Mann-Whitney test; ns, p>0.05; *p≤0.05; ****p<0.0001.

