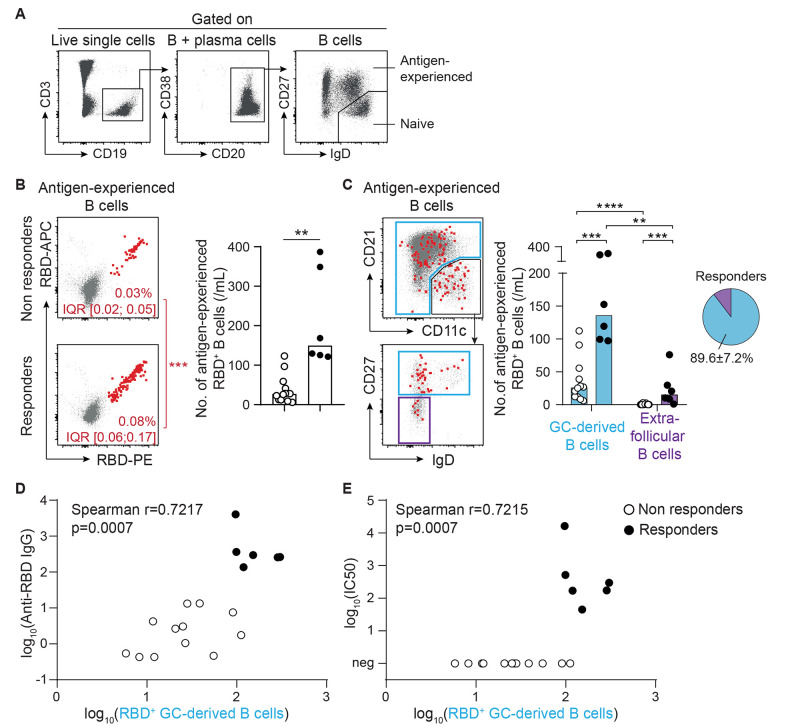
Fig. 4.
Generation of neutralizing IgG antibodies after vaccination is associated with evidence of a germinal center reaction. (A) The gating strategy used for flow cytometry analysis of RBD-specific B cell response is shown. (B) RBD-specific cells were enumerated among antigen-experienced B cells in the circulation of vaccinated renal transplant recipients. Left panel: concatenated flow cytometry profiles of non-responders (upper thumbnail) and responders (lower thumbnail) to vaccine are shown. Median percentage and interquartile range are indicated. Proportions of RBD-specific B cells were compared. Right panel: the numbers of RBD-specific antigen-experienced B cells of non-responders (n=12; open circles) and responders (n=6; black circles) were compared. (C) The site in which the humoral response against the vaccine developed was indirectly analyzed based upon the phenotype of RBD-specific B cells. Extrafollicular responses are characterized by the generation of type 2 double-negative (CD11chigh CD21low IgD- CD27-) B cells (purple gate). The rest of antigen-experienced B cells (blue gates) are thought to be derived from the germinal center. Left panels: concatenated flow cytometry profiles of all vaccinated patients are shown, together with the gating strategy used for analysis. Right panel: Bar graphs (left) show the number of RBD-specific antigen-experienced B cells likely derived from germinal centers (GC, blue) or extrafollicular (purple) responses for non-responders (n=12; open circles) and responders (n=6; black circles) to vaccine. The proportions of RBD-specific antigen-experienced B cells derived from germinal center and extrafollicular responses in responders to vaccine are shown in the pie chart (right). Data in (B and C) were analyzed using a Mann-Whitney test. **p<0.01; ***p<0.001; ****p<0.0001. (D and E) The correlation between the number of germinal center-derived RBD-specific antigen-experienced B cells and the titer of anti-RBD IgG (D) or the viral neutralization capacity of the serum (E) are shown. The results of Spearman correlation test are shown on the graphs.

