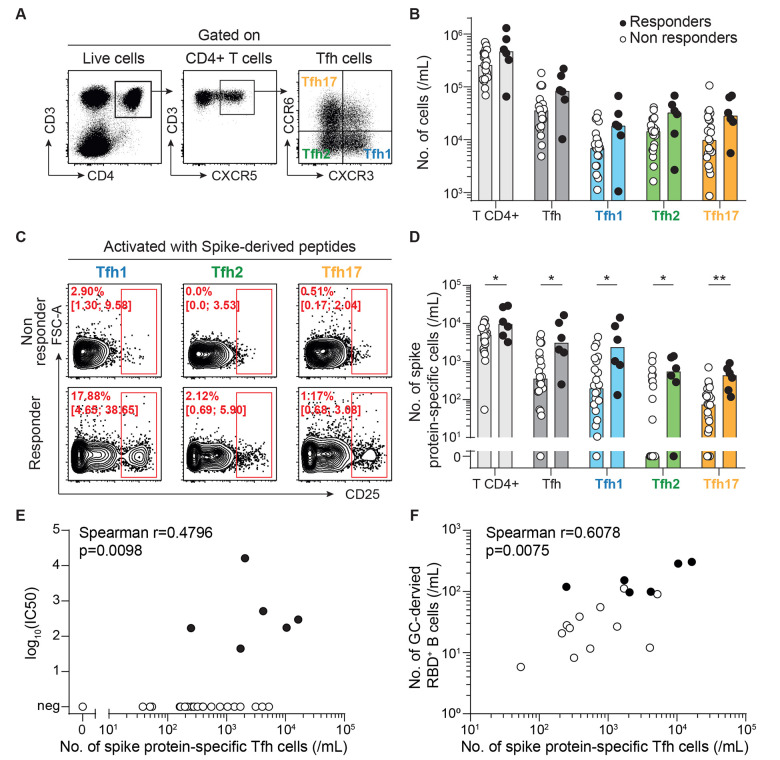
Fig. 5. Generation of neutralizing antibodies after vaccination correlates with the number of spike protein-specific Tfh cells.
Follicular helper T cells (Tfh) were enumerated in the circulation of responders (n=6; black circles) and non-responders (n=22; open circles) after two doses of SARS-CoV-2 mRNA vaccine. (A) Representative flow cytometry profiles are shown with the gating strategy used to identify the 3 subsets of follicular helper T cells (Tfh): Tfh1 (blue), Tfh2 (green), and Tfh17 (orange). (B) The counts of circulating CD4+ T cell subsets are plotted for each patient. (C and D) Spike protein-specific cells were enumerated among each CD4+ T cell subset for each vaccinated patient. Data were background subtracted against a DMSO-only negative control. (C) Representative flow cytometry profiles of non-responders (upper row) and responders (lower row) are shown. Median percentage and interquartile range are indicated. (D) The counts of circulating spike protein-specific CD4+ T cell subsets are plotted for each patient. Bars indicate median values. Data in (D) were compared using Mann-Whitney tests. *p<0.05; **p<0.01. (E) The correlation between the number of spike protein-specific Tfh cells and viral neutralization capacity of the serum is shown. The result of Spearman correlation test is shown on the graph. (F) The correlation between the number of spike protein-specific Tfh cells and germinal center-derived RBD-specific antigen-experienced B cells is shown. The result of Spearman correlation test is shown on the graph.

