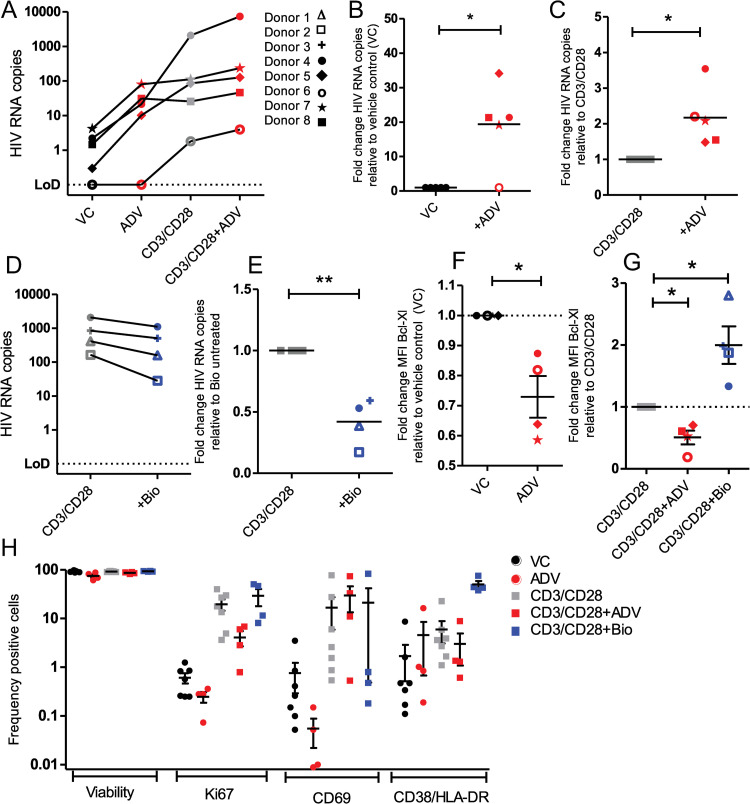
Fig 6. β-catenin modulation impacts HIV latency reversal in cells from HIV-infected virally suppressed individuals.
(A) CD8-depleted PBMCs from n = 5 HIV positive donors on suppressive cART therapy were treated for 48 hours with 50 nM β-catenin inhibitor ADV, αCD3/αCD28 T-cell activating beads alone or combined with 50 nM ADV. Extracellular (released virions, right) HIV RNA copies were quantified. Absolute RNA copy numbers in vehicle control and ADV treated cultures are shown, with lines connecting samples from the same donor. Symbols corresponding to donors in Table 2 are used for panels a-g. (B) Fold change of RNA copies in ADV treated cultures over vehicle control are shown from released virus. (C) Fold change of RNA copies in ADV co-treated cultures over αCD3/αCD28 single treatment. (D) As in (A), cells were treated with αCD3/αCD28 beads alone or combined with 2 μM 6Bio. HIV RNA quantities are shown with lines connecting cultures from the same donor. (E) Fold change of HIV RNA copies in 6Bio co-treated cells over αCD3/αCD28 single treatment. (f-g) Downstream target of β-catenin, Bcl-xL, was quantified by flow cytometry in cells treated with ADV, αCD3/αCD28, or αCD3/αCD28 with ADV/6Bio, to confirm the modulation of β-catenin by these drugs. Fold change in mean fluorescence intensity of Bcl-xL is shown compared to vehicle control or αCD3/αCD28 treated cells, for single or dual treated cells, respectively. (H) Viability and T cell activation markers in cells following drug treatments were quantified by flow cytometry. The proportion of CD3+ CD4+ T cells expressing Ki67, CD69, CD38/HLA-DR, or LIVE/DEAD stain are plotted for cells treated with the indicated treatments. Significance was determined using paired t-tests for all panels, * p<0.05, ** p<0.01.

