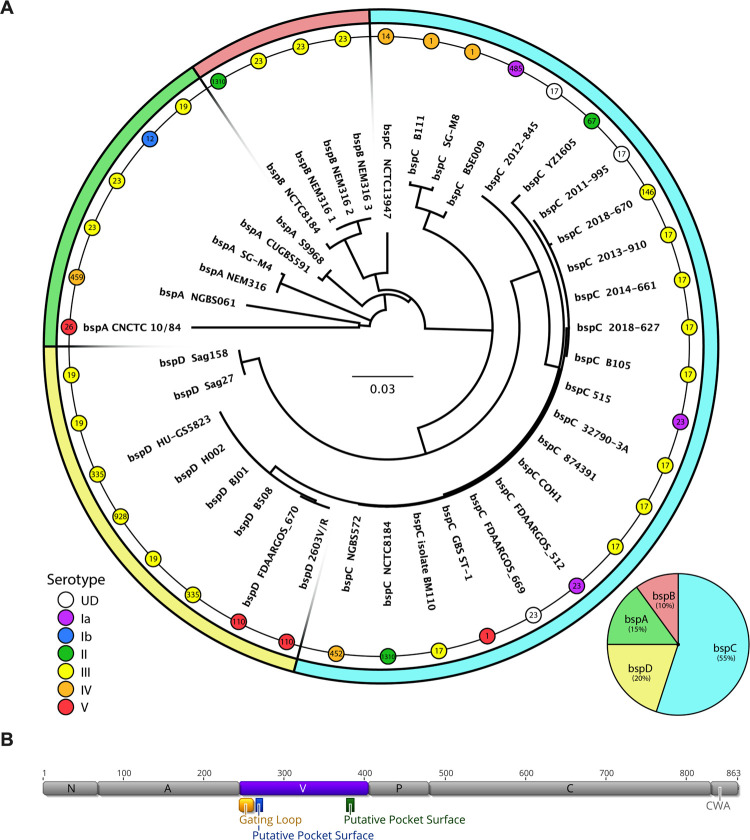
Fig 1. Bsp Distribution and Conservation.
(A) The amino acid sequences listed in S1B Fig were used to form a neighbor-joining phylogenetic tree calculated by a Blosum80 cost matrix and Jukes-Cantor genetic distance model. The scale bar in the center indicates the distance representing 0.03 substitutions per site. Serotype of each strain is indicated by a colored node, while sequence type is indicated by a number within each node. This tree is overlaid on a pie chart which shows the distribution of each bsp homolog (also shown in the bottom right). (B) The gene structure for COH1 bspC is shown, with specific domains and relevant regions within the V-domain annotated.

