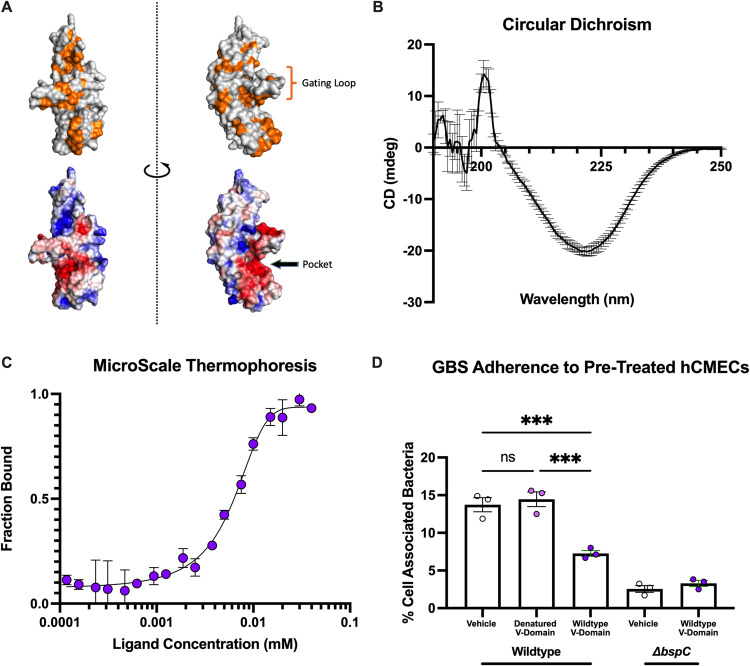
Fig 2. Mapping vimentin binding activity to the BspC V-domain.
(A) The V-domain of BspC was modeled using BspA as a template. Surface residues are shown with hydrophobic residues colored in orange (top) and electrostatic potential as calculated by APBS (bottom) colored with red indicating higher potential and blue indicating lower potential. APBS calculation and visualization were performed using PyMOL. (B) Circular dichroism spectrum of a 1 mg/mL solution of the BspC V-domain. (C) The V-domain was added to 20 nM vimentin at the indicated concentrations prior to measuring the microscale thermophoresis dose response curve quantifying the dissociation constant. (D) hCMECs were pretreated with PBS (vehicle), the V-domain added to a concentration of 10 μM, or 10 μM of denatured V-domain 30 minutes prior to infection. CFU were plated and to assess V-domain blocking of GBS adherence after 30 minutes of incubation. B-D display means from 3 independent experiments. Error bars indicate standard error of the mean. Statistical analysis: (D) One-way ANOVA with Tukey’s multiple comparisons. ***, P < 0.0005.

